
Blog
Practical guides on order flow, GEX and futures trading — from the basics to advanced tape reading.
GEX & Options Levels
Dealer gamma exposure, Gamma Flip, Call Wall and Put Wall — how the options market moves futures and how to use it intraday.

Free Daily Gamma (GEX) Levels for NQ and ES: Where to Get Them and How to Use Them
Where to find free daily gamma exposure levels for Nasdaq-100 (NQ) and S&P 500 (ES) — Gamma Flip, Call Wall, Put Wall, net GEX regime and Max Pain — computed from delayed index option chains and refreshed through the US session, plus a 60-second guide to trading them.

How to Read GEX: Gamma Flip, Call Wall and Put Wall for Beginning Traders
A plain-language guide to dealer gamma exposure — why the market grinds above the Gamma Flip and crashes below the Put Wall, what fuels V-shaped recoveries, and how to combine GEX with order flow.
Order Flow & Delta
Aggressive vs passive orders, delta, CVD, footprint and big trades — how to read who actually moves the market and avoid the most common traps.
Footprint and Heatmap Synergy: Practical Day Trading Setups for Futures
Learn how to combine what is offered (resting limit orders on the heatmap) with what is actually happening (aggression on the footprint). A practical guide for day trading futures.
How to Spot Institutional Activity on Footprint Charts
Large institutional players leave clear footprints in the market. Learn how to read stacked imbalances, oversized imbalances, and aggressive market sweeps on a footprint chart.

Bar Delta: Short-Term Absorption, Breakout Confirmation and the Overtrading Trap
Per-bar delta tells you who won a single candle. Learn to read delta/candle-colour mismatches, confirm breakouts, and avoid the most common trap — trading every absorption.

Bid/Ask Volume: Who Really Moves the Market (and Why You Read It Diagonally)
The foundation of all order flow: aggressors vs passive players, why price only rises when the offer is consumed, and the most common beginner mistake — reading numbers side by side instead of diagonally.

Footprint: Imbalance, Absorption and Unfinished Auctions Without the Myths
The footprint shows the battle inside every candle. A practical guide: when an imbalance matters, the three conditions of real absorption, what an unfinished auction is (not) for, and why footprints work best on futures.

The Pressure Meter: Context at a Glance, Not an Entry Signal
A combined buyer-vs-seller pressure gauge blends aggressive delta with order-book imbalance. How to read it properly, why it is not a traffic light for entries, and when its divergence means absorption.

Big Trades: The Anomalies That Set the Direction of the Day
Extreme volume at the daily high/low, exhaustion, sweeps and fading bubbles — how to read large aggressive prints, what sizes are truly extreme on ES and CL, and why context decides everything.

How to Read CVD (Cumulative Delta): Big-Player Traps and Divergences
CVD shows who is actually pouring money into the market. Learn to read long-term absorption, divergences, and the biggest mistakes beginners make with cumulative delta.
Market Depth & Liquidity
The order book, liquidity heatmap, walls, spoofing and icebergs — what resting limit orders say about the market and when (not) to trust them.

Spoofing vs. Absorption: Decoding Large Traders on the Liquidity Heatmap
Learn how to read market depth. A comprehensive guide to distinguishing between spoofing (fake liquidity) and real absorption (replenishing limits) on the heatmap.

Iceberg Orders: How to Spot the Hidden Player (and When Not to Trust It)
An iceberg shows only the tip — executions massively exceed the visible size. How detection works, its limits on MBP data, when an iceberg fails, and how to trade with it (never blindly against it).

Liquidity Heatmap: Telling a Real Wall from a Decoy
A bright zone on the heatmap is a hypothesis, not a fact. Learn to tell absorption from spoofing, read pulling liquidity, and combine walls with real executions — without the classic beginner mistakes.
Volume Profile
POC, Value Area, HVN/LVN, acceptance and rejection of value — how to read the map of traded volume and build a trading plan on it.

How to Trade Anchored Volume Profile: Accumulation, HVNs, and LVNs
Anchored Volume Profile is a key tool for finding institutional value and placing stop losses. Learn to read P/D shapes, HVN support zones, and LVN gaps.

How to Trade VWAP: Deviation Bands, Slopes, and Retail Traps
VWAP is the single most important indicator used by institutional players. Learn how to set standard deviation bands, filter trend strength, and avoid traps.

Volume Profile: POC, Value Area and the Anomalies the Market Comes Back to Repair
The map of traded volume: how to read the POC, the 70% Value Area, HVN/LVN, acceptance and vanishing volume — and why trading computed lines without context is the biggest mistake.
MotiveWave & Setup
How to turn the free MotiveWave Community Edition into a full order-flow platform — what the edition does, what it lacks and how to add it.

How to Get and Read Cumulative Volume Delta (CVD) in MotiveWave Free Edition
A complete guide to running Cumulative Volume Delta (CVD) in the free MotiveWave Community Edition. Learn how to identify absorption and divergence directly on your chart.

Footprint Charts in MotiveWave: Comprehensive Guide and Setup
Learn how to get and configure footprint (cluster) charts in the MotiveWave platform. A setup guide for imbalances, absorptions, and the Totals table on the free edition.

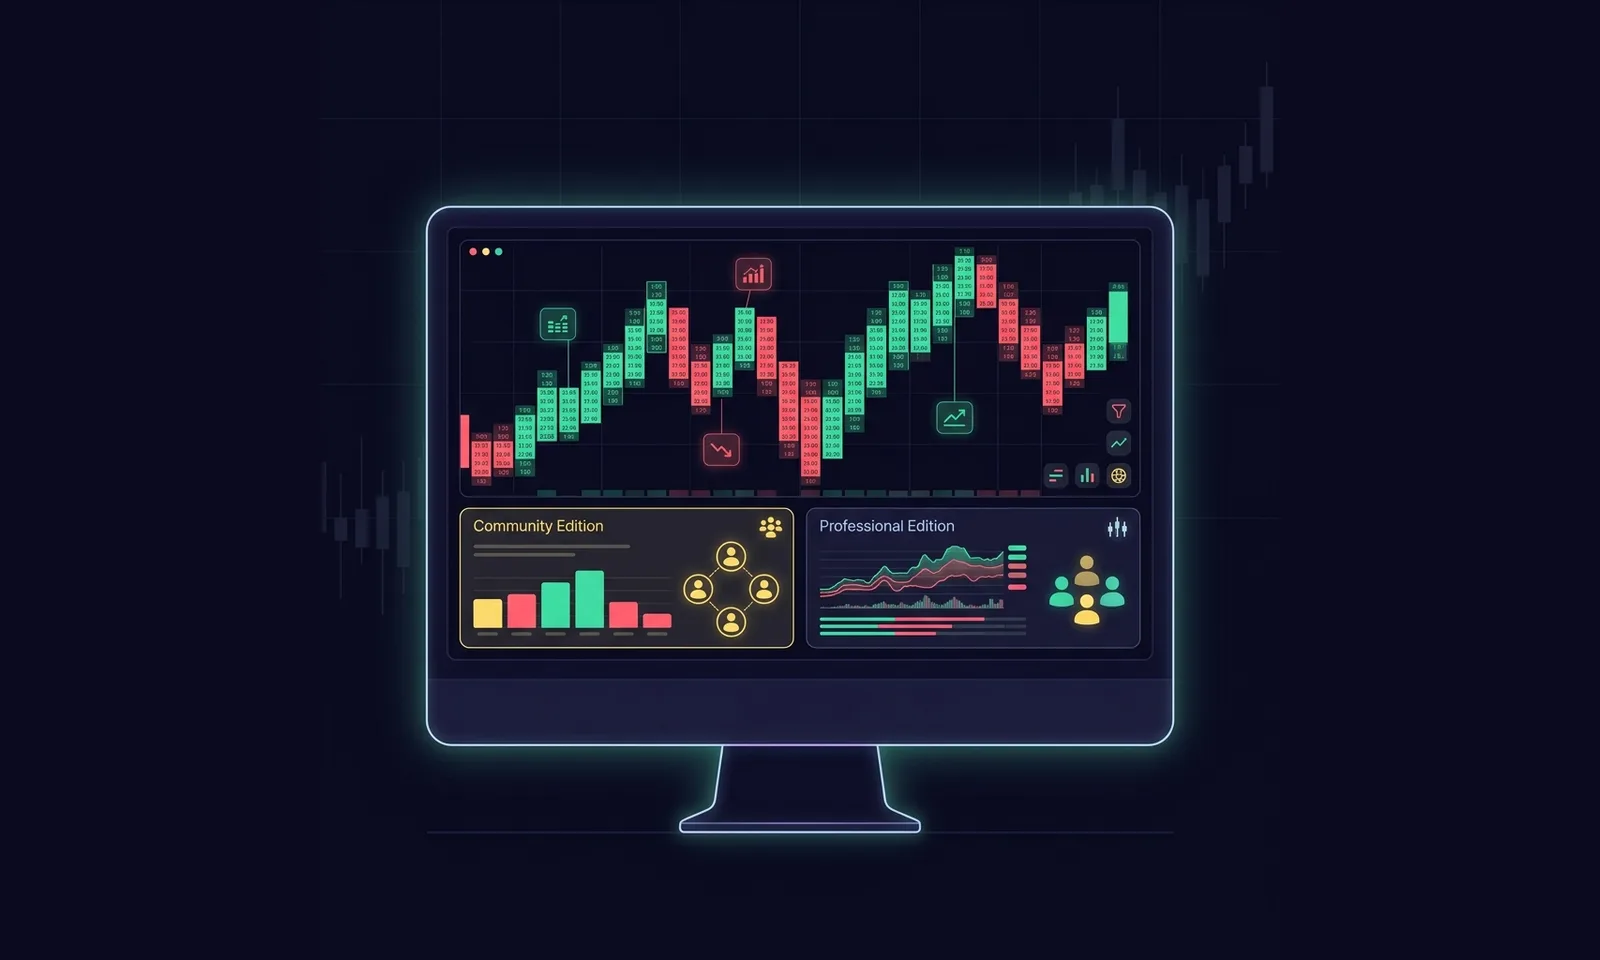
MotiveWave Editions Compared: Finding the Best Setup for Order Flow
A detailed comparison of MotiveWave Community Edition and paid tiers for order flow. Learn which features you lack and how to add them without an expensive upgrade.

Smooth Replay Playback in MotiveWave Community Edition: Speed Control via Tick Delay
How to set up smooth continuous chart replay in MotiveWave Community Edition — controlling speed with Tick Delay, the Fast Forward button, and one critical gotcha: Tick Delay changes only take effect after you disable and re-enable replay mode.
How to Get Footprint Charts and Order Flow in MotiveWave Community Edition
The free MotiveWave Community Edition has no built-in footprint or order-flow studies — but you can add them. Here is exactly what the free edition includes, what it is missing, and how to get footprint, CVD and a liquidity heatmap onto your chart without paying for an expensive edition upgrade.