Before footprint, CVD or a heatmap can make sense, you must understand one thing: only aggressive orders move the market. Bid/Ask volume is the simplest window into that world — it splits every traded contract by who the aggressor was.
Market mechanics in four sentences
- At every price level sit passive limit orders (bids below, asks above) — these are barriers, the market's natural supports and resistances.
- Aggressors (market and stop orders) crash into those barriers: a market buy pairs with a waiting ask, a market sell with a waiting bid.
- For price to move a single tick higher, aggressive buying must completely consume the passive offer at the current price. As long as the offer outweighs the inflow of buyers, the level holds.
- Book depth changes within seconds (375 contracts → 100 in two seconds). That is why you don't trust what "sits" in the book — you trust what actually trades.
The key insight that follows: candlestick patterns and trendline bounces are shadows — the real cause of every turn is always where aggressors met passive liquidity.
The most common mistake: reading side by side
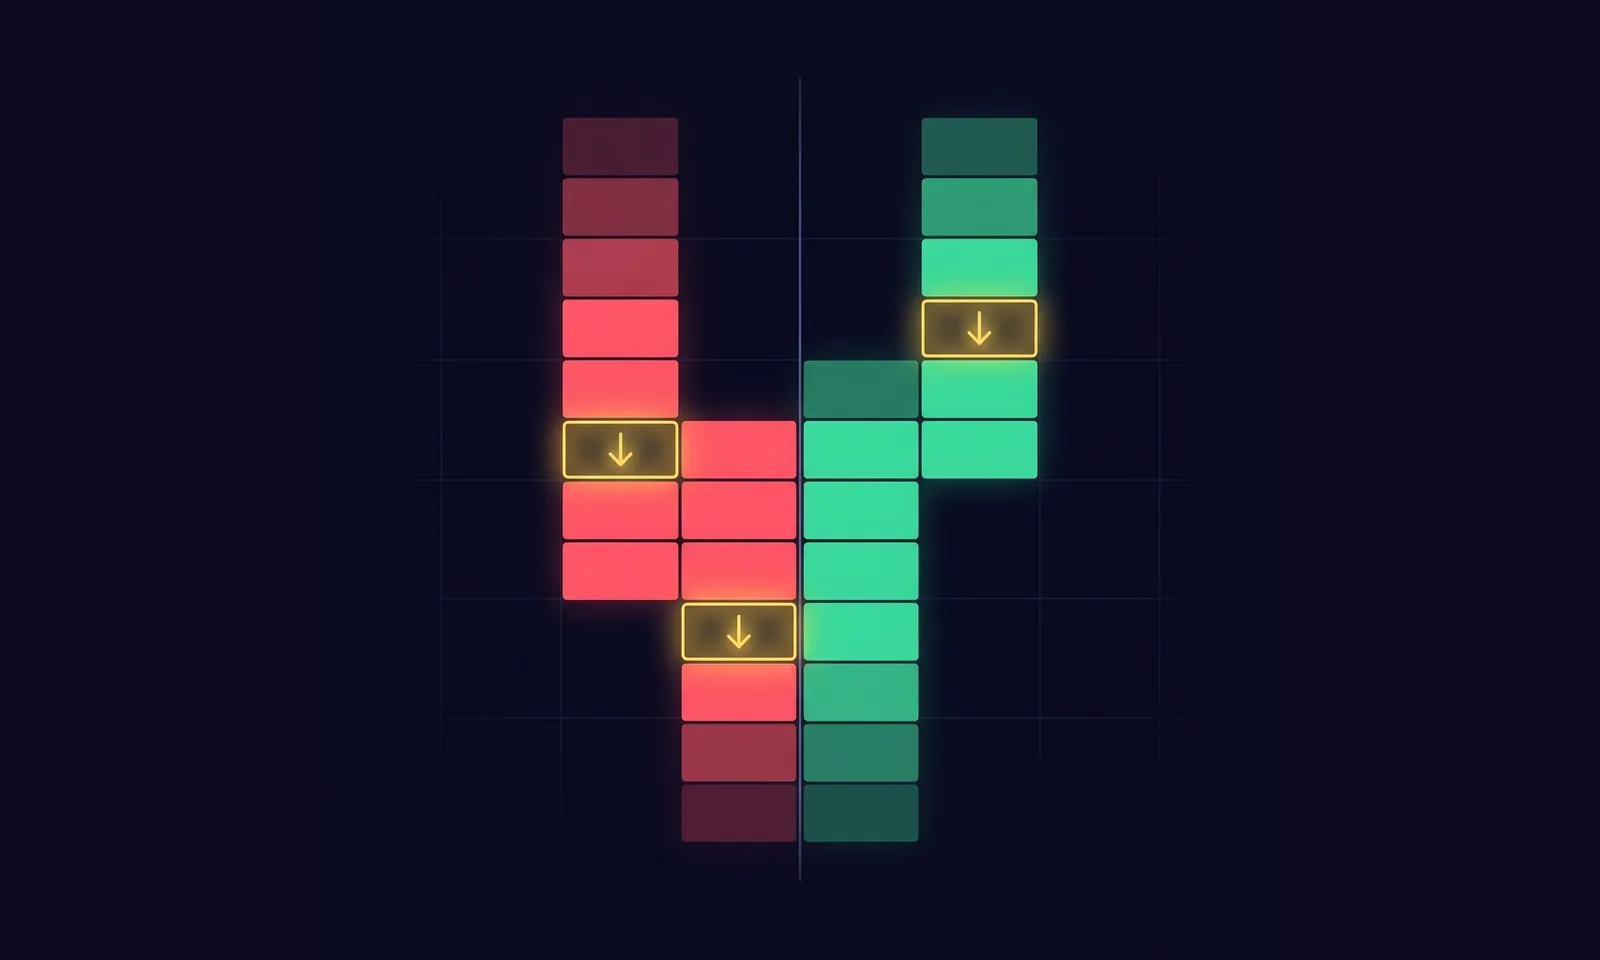
Order flow is never read horizontally (bid and ask on the same row) but diagonally (across): aggressive buys at price P are compared with aggressive sells at price P−1. Why? Because buyers at P are consuming the offer that sellers defend one tick lower — the diagonal compares the forces that are actually fighting each other. Side-by-side reading produces nonsense conclusions about dominance.
What Bid/Ask volume tells you
- Intra-session pressure crossover: when the aggressive-buy curve crosses the sell curve, intraday dominance is changing — fast context on who is taking control.
- Quality of a reaction at a level: is aggressive buying growing at support, or is selling merely drying up? Two different messages, two different qualities of a long.
- Objectivity: instead of guessing from candle shapes you see "behind the curtain" — how many buyers and sellers actually met inside the bar.
What to watch out for
- Passive players are not necessarily speculators — much of limit liquidity is hedging and client order filling. Don't speculate about "who it is"; work with the fact that it is there.
- Without context, dominance is just a number. Aggressive buying into strong resistance often ends as absorption — combine with levels and the footprint.
- Liquidity is relative. The same numbers mean something different on NQ than on a micro — always scale to the instrument's normal.
Style fit and what it brings
Bid/Ask volume is the basic building block for every intraday style — from scalping to day trading. It is not an entry signal; it is literacy: once you see the market as a battle of aggressors against passive liquidity, you stop trading shapes and start trading causes.
Frequently asked questions
What is the difference between bid and ask volume?
Ask volume = market orders lifting the ask (aggressive buyers); bid volume = market orders hitting the bid (aggressive sellers). Each trade's aggressor side decides which bucket it lands in.
How is this different from delta?
Delta is ask volume minus bid volume — one net number. Bid/Ask volume shows the two streams separately, so you also see total participation, not just the net.
What does a crossover mean?
When the leading side flips mid-bar (ask volume overtakes bid volume or vice versa), it marks an intra-bar shift in who is aggressive — an early read on momentum changing hands.
Is high ask volume bullish?
It shows aggressive buying, but if price does not rise with it, that is absorption. Effort only matters next to the price result.
How do bid/ask volume, delta and CVD fit together?
Bid/Ask is the raw split, delta is their per-bar difference, and CVD is the cumulative sum of delta. Same data, three levels of zoom.
The Bid/Ask Volume study in WyckFlow is free — it plots aggressive buy and sell volume as two curves with the intraday pressure crossover. Related reading: Bar Delta, CVD.