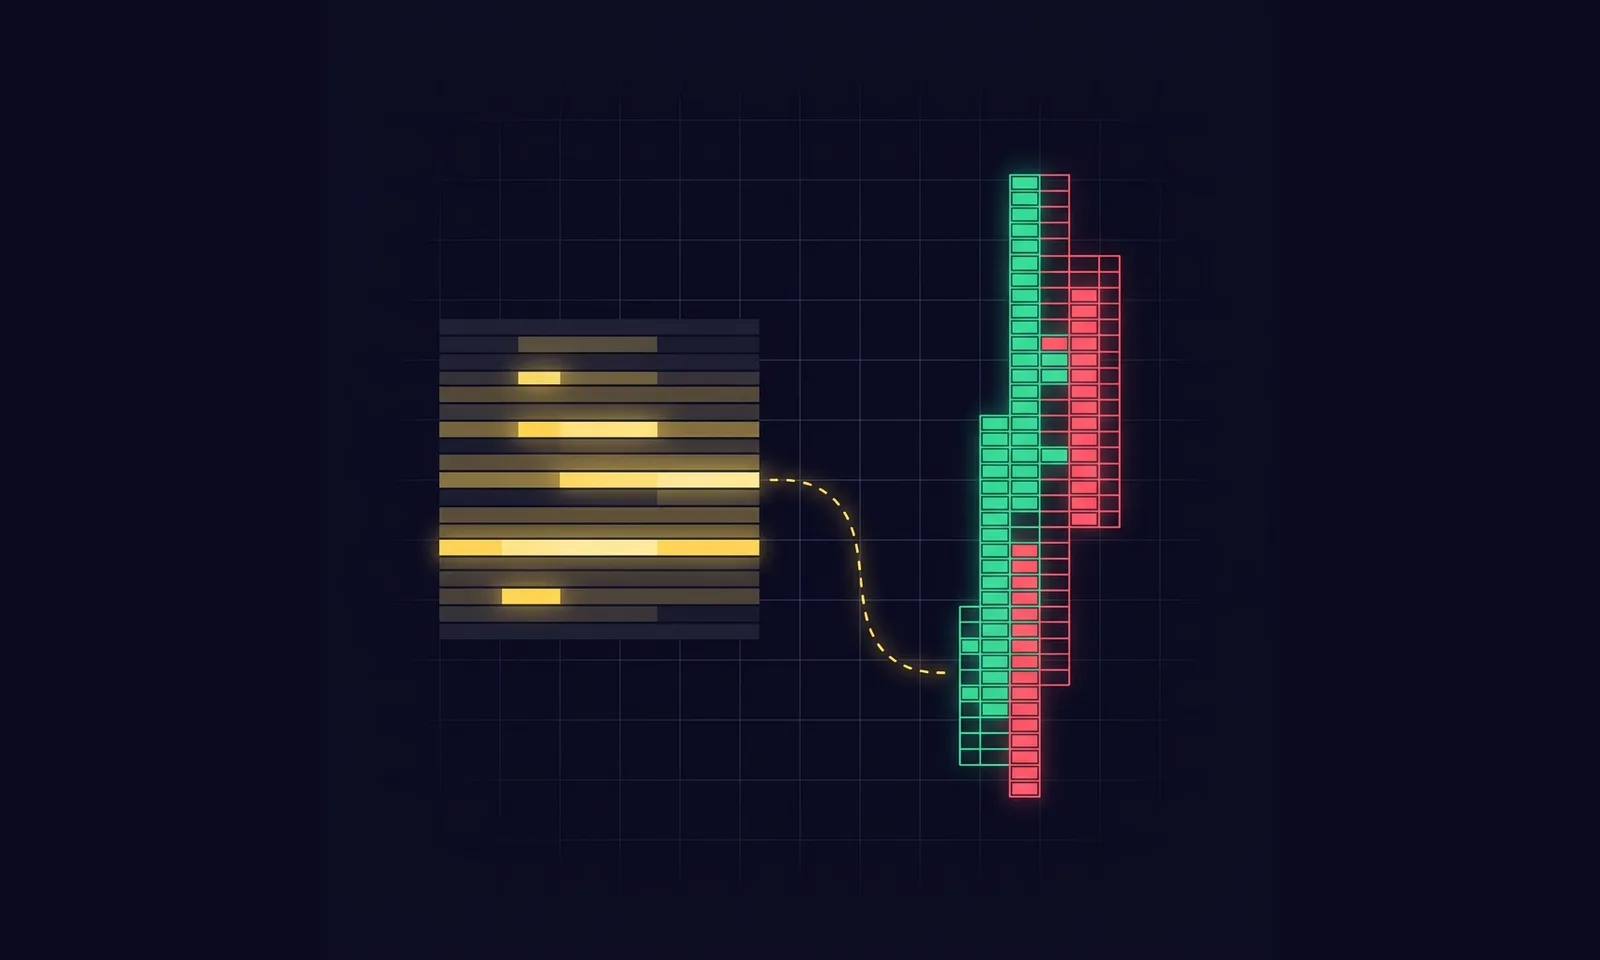
CVD (Cumulative Volume Delta) is the running sum of delta — the difference between aggressive buys (market buys into the ask) and aggressive sells (market sells into the bid). A candle shows only the outcome; CVD shows who pushed and how hard. It is one of the most objective tools in order flow: volume cannot be faked.
What CVD is — and what it is not
- CVD is the sum of per-bar delta from a chosen reset (typically the session start; it resets daily).
- CVD does not show the future. It shows what orders are flowing into the market right now — who the aggressor is. The interpretation is yours.
- Only aggressive orders (market and stop) move price. Passive limit orders form barriers. CVD measures exactly the aggressive side.
The most valuable signal: long-term absorption (the retail trap)
The strongest use of CVD is spotting a side that got stuck in its positions:
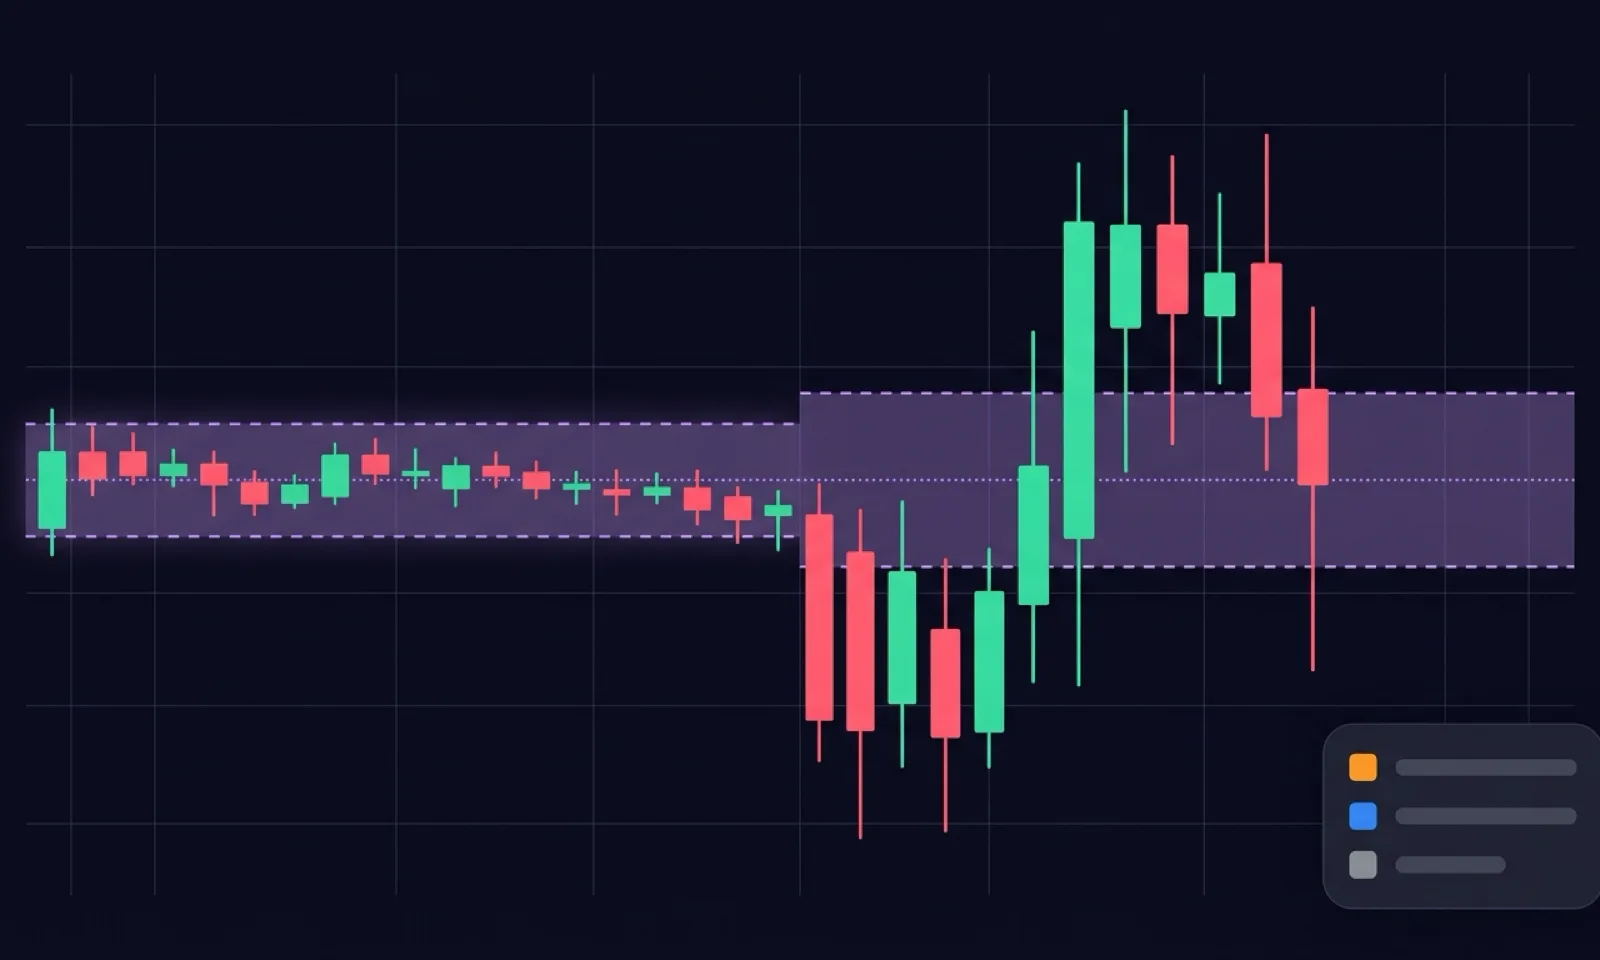
- The market rotates sideways (price isn't really falling)…
- …but CVD falls aggressively — sells keep flowing in.
- Conclusion: aggressive sellers are falling into the trap of a passive buyer (often institutional). Their shorts are underwater.
- When the market finally kicks above the swing high where those trapped sellers keep their stops, the move tends to be fast and its destination predictable — forced buy-backs fuel it.
You'll typically see this after a "textbook liquidity grab" that retail reflexively shorts — and CVD tells you they are still sitting in those positions.
Divergences: when they are valid and when not
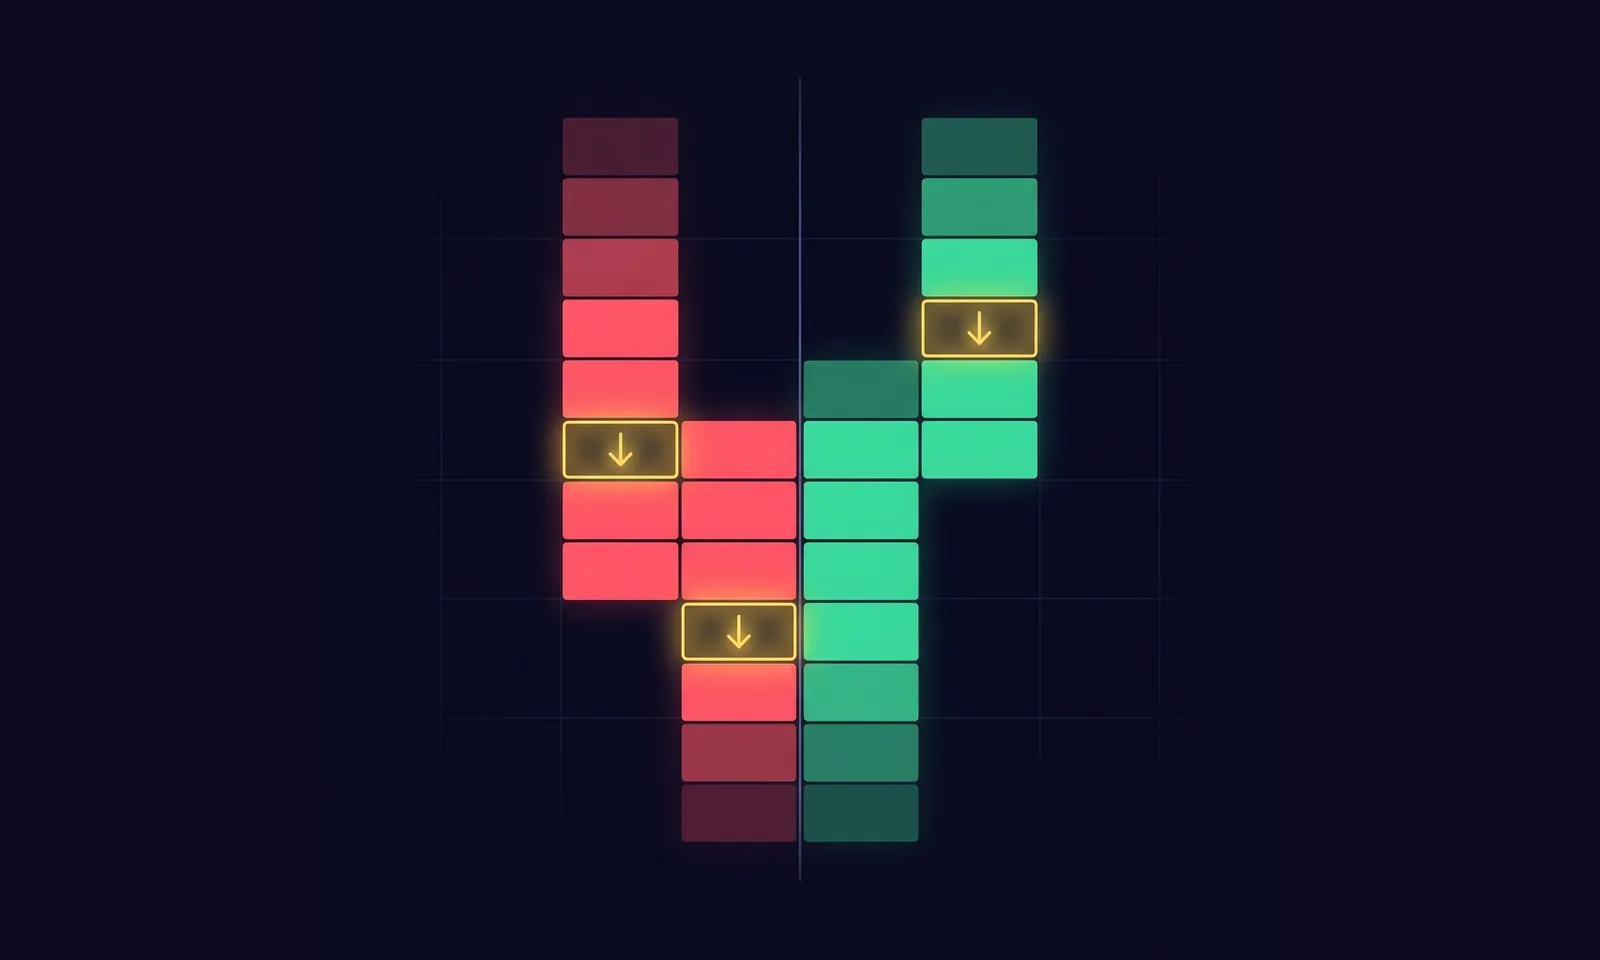
- Classic (exhaustion): price makes a new high, CVD doesn't → buyers are running out of fuel. Valid primarily at a key level (S/R zone, value area, session extreme) — mid-trend with no level it's a weak signal.
- Hidden (absorption): CVD pushes hard, price stalls → someone is passively accumulating. Look for confirmation in the footprint (volume at the extreme + rejection).
- Compare pivot against pivot within the same session — a divergence across the daily CVD reset is a calculation artifact, not a signal.
The most common mistakes
- Entering blindly mid-rotation because "CVD is falling". In a rotation a stop loss is nearly impossible to place — wait for structure (a break, a stop run).
- Speculating who the big player is. Bank, fund or hedger — it doesn't matter. What matters is that the absorption IS there, not why.
- Trading every divergence. Without confluence with a level it's a road to overtrading.
- Ignoring the reset. Comparing today's CVD to yesterday's absolute number is meaningless.
Style fit and what it brings
CVD is primarily a day trading tool (on intraday NQ, ES, CL charts); for scalpers it serves as fast context on who owns the session. What it adds to your trading is priceless: the objective story of the session — who is attacking, who is trapped, and where forced liquidations are likely to ignite.
An honest note: CVD does not say where the market will go. It says who is trying, how hard — and who is bleeding while doing it. Always confirm entries with structure and levels, never with the line alone.
Frequently asked questions
What does CVD actually measure?
It sums each trade's aggressor side — market buys minus market sells — so it tracks who is crossing the spread to get filled (the aggressive money), not total volume.
What is a CVD divergence?
Price makes a new high or low but CVD doesn't follow. It means the push lacks aggressive follow-through — the fuel is fading — and it often precedes a stall or reversal. It's a warning, not an entry on its own.
What is absorption on CVD?
Delta keeps rising (aggressive buying) but price refuses to advance — a passive seller is absorbing every market buy. When the aggressors give up, price frequently reverses against them.
Why does my CVD look different across platforms?
CVD depends on how each feed classifies a trade as buyer- or seller-initiated and when the line resets (session, day, never). Compare like with like and stick to one consistent reset.
Can I trade with CVD alone?
No. CVD shows effort and who is bleeding, not direction. Combine it with market structure, key levels and the footprint or heatmap for the actual entry.
The Cumulative Volume Delta study in WyckFlow is free — it draws CVD as OHLC candles, detects divergences automatically (including live, not-yet-confirmed ones) and supports session and custom resets. Related reading: Footprint: Imbalance & Absorption, Bar Delta, How to Read GEX.