VWAP (Volume-Weighted Average Price) is one of the few indicators actually used by institutional algorithms and large players. Unlike a standard moving average (MA), which only accounts for time and price, VWAP assigns weight to volume. If a huge volume is traded at a specific price, the VWAP line will be pulled toward it. If the price moves on thin volume, the VWAP barely moves.
For large institutions, VWAP serves as an execution benchmark: buying below VWAP is considered good (cheap), while selling above is advantageous (expensive). This creates an immense gravitational pull back to this line.
Key Settings: Anchors and Reset Periods
For VWAP to make sense, it must have a correct anchor point – the starting moment from which it begins accumulating volume and price data. WyckFlow VWAP offers several reset modes:
- Session (RTH / ETH): Resets at the start of the day (either regular trading hours only, or including extended hours). Ideal for intraday futures (ES, NQ) and stock day trading.
- Weekly / Monthly: Resets at the start of the week or month. Excellent for swing trading and determining long-term bias.
- Rolling: A rolling window of the last N days (typically 5 or 21 days). This solves the "Monday problem," where a weekly VWAP is too sensitive on Monday morning due to lack of data.
- Anchored: Manually anchored to a specific time (e.g., macro news release, major swing high/low, or market open).
Standard Deviation Bands (σ) and Extremes
Around the VWAP line, we plot bands based on the volume-weighted Standard Deviation (SD). These zones represent statistical extremes:
- ±1σ Band: Approximately 68% of all trading activity occurs here. It acts as the first support/resistance zone. If price breaks outside ±1σ and stays there, the market is in a strong trend, making counter-trend plays (shorts in an uptrend) highly dangerous.
- ±2σ Band: Covers roughly 95% of trading activity. Touching this band is a statistical anomaly, and the market tends to exhaust itself and revert back to the VWAP.
- ±2.5σ to ±3σ Bands: Represent maximum market extension (occurring less than 1-3% of the time). This is where buyers/sellers exhaust themselves, providing the highest probability setups for mean reversion trades.
3 Core VWAP Strategies
1. Trend-Pullback (Re-entering the Trend)
In a strongly trending market (the VWAP slope points clearly up or down), do not wait for a return to the opposite extreme. Instead, look for a pullback to the VWAP line itself (or the ±1σ band). Once price stabilizes and order flow (e.g., footprint chart) shows absorption, enter in the direction of the trend.
2. Mean Reversion (Returning to Fair Value)
If the market is range-bound (the VWAP slope is flat) and price spikes aggressively to the ±2.5σ or ±3σ band, look for counter-trend opportunities back to the VWAP. Never enter blindly; wait for a rejection on a lower timeframe (e.g., 1-minute chart) confirmed by volume exhaustion or stop runs.
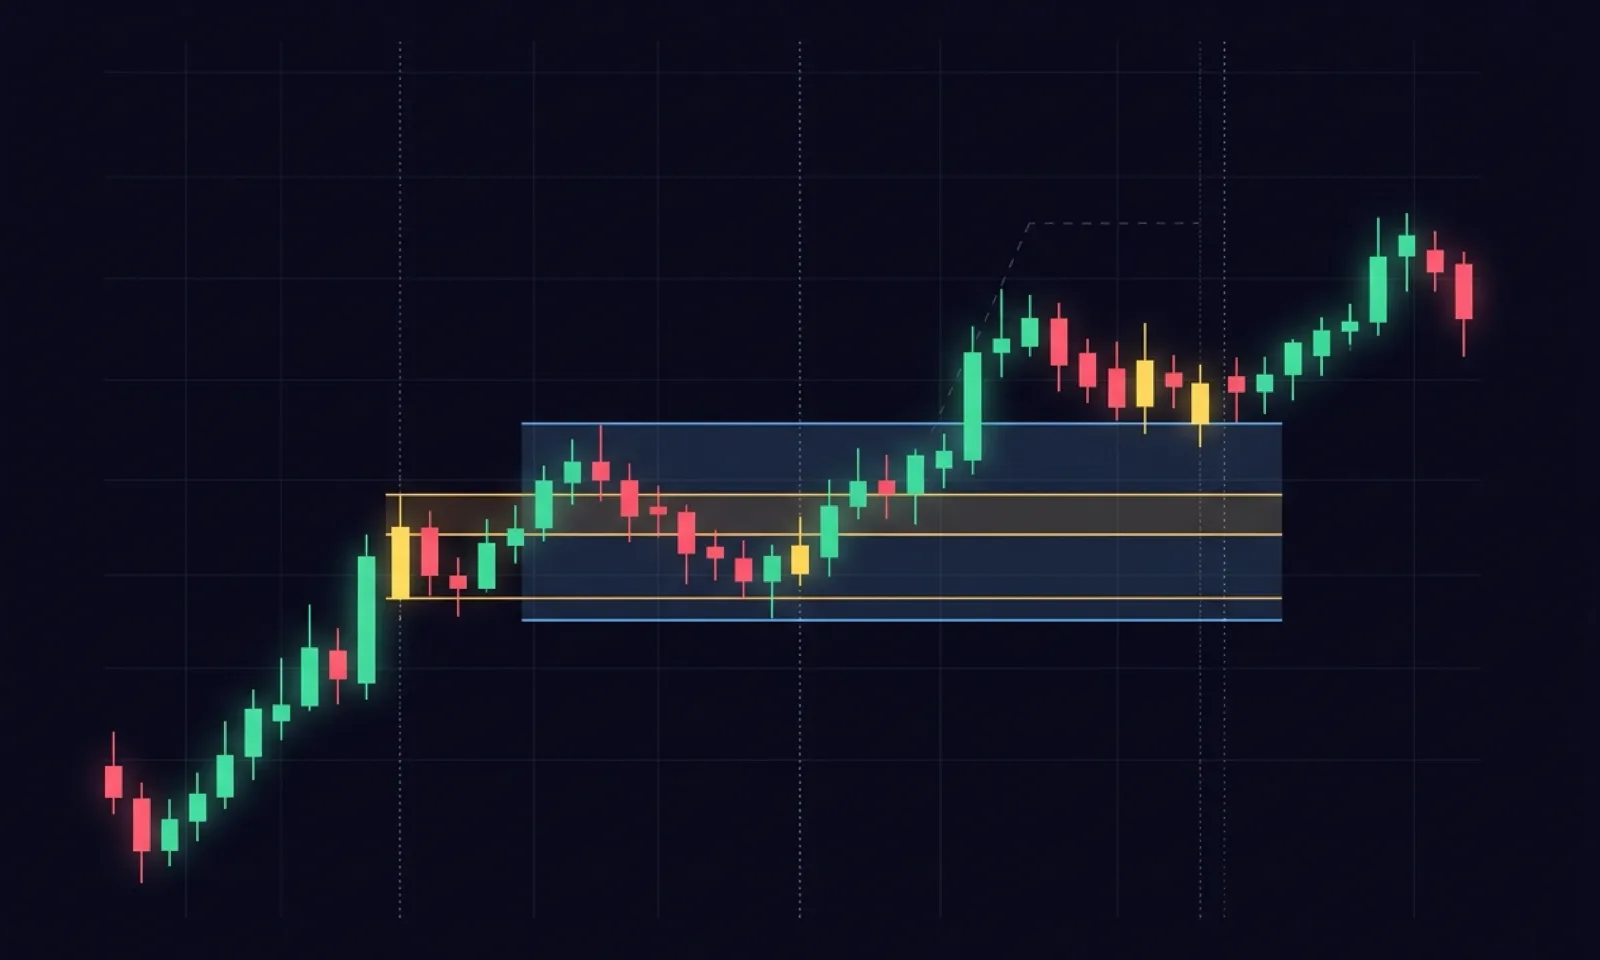
3. Prior-Period VWAP as Support/Resistance
The VWAP from the previous period (yesterday's RTH VWAP, last week's VWAP) acts as a very strong horizontal support and resistance level. Institutional algorithms remember these levels, often leading to sharp reactions.
Common Retail Mistakes
- Shorting a Strong Trend at +2σ: If the price is rising and holding steadily above the +1σ band, touching +2σ does not guarantee a reversal. The market can ride this band for hours. Ensure the VWAP slope is flattening and trend exhaustion is visible.
- Ignoring the Reset and Session: Comparing absolute intraday VWAP values across different days is meaningless. Every session starts with a clean slate.
- Buying Into a Falling VWAP: If the VWAP slope is pointing sharply down, buying a touch of the VWAP from below is catching a falling knife. The line will act as a major resistance level.
Honest Note: VWAP is not a magic line that predicts the future. It simply shows where the center of gravity of traded volume lies. Always combine VWAP with market structure and key horizontal support/resistance levels.
Frequently Asked Questions
What is the difference between VWAP and a moving average (EMA/SMA)?
A moving average calculates the average price of a set number of candles. VWAP factors in both the price and the volume traded at each price since the session reset, making it a much more accurate representation of "fair value."
Which standard deviation bands are best for intraday trading?
For major index futures (NQ, ES), the ±1σ band (for trend strength filtering) and the ±2σ band (for mean reversion) are most common. For scalping reversals, adding ±2.5σ or ±3.0σ can help identify highly exhausted market extremes.
What does the slope of the VWAP line indicate?
The slope (rising, falling, flat) shows the direction of the aggregate order flow for the session. A rising slope indicates aggressive buying pressure, a flat slope indicates a balanced, ranging market, and a falling slope indicates distribution and selling pressure.
Can I use VWAP on a daily chart?
A traditional intraday VWAP resets on every candle on a daily chart, which is not useful. For daily and higher timeframes, use Weekly VWAP, Monthly VWAP, or Anchored VWAP locked to a significant swing or event.
Why is VWAP choppy at the start of the session?
Shortly after the session opens (reset), there is very little volume and price data in the calculation. Any large trade will cause the VWAP line to jump. As the day progresses and volume accumulates, the line becomes much more stable.
The WyckFlow VWAP study plots volume-weighted bands, extends prior-period levels, and supports flexible resets by session or custom date/time. Related reading: Understanding CVD & Divergences, Anchored Volume Profile Guide, How to Read GEX.