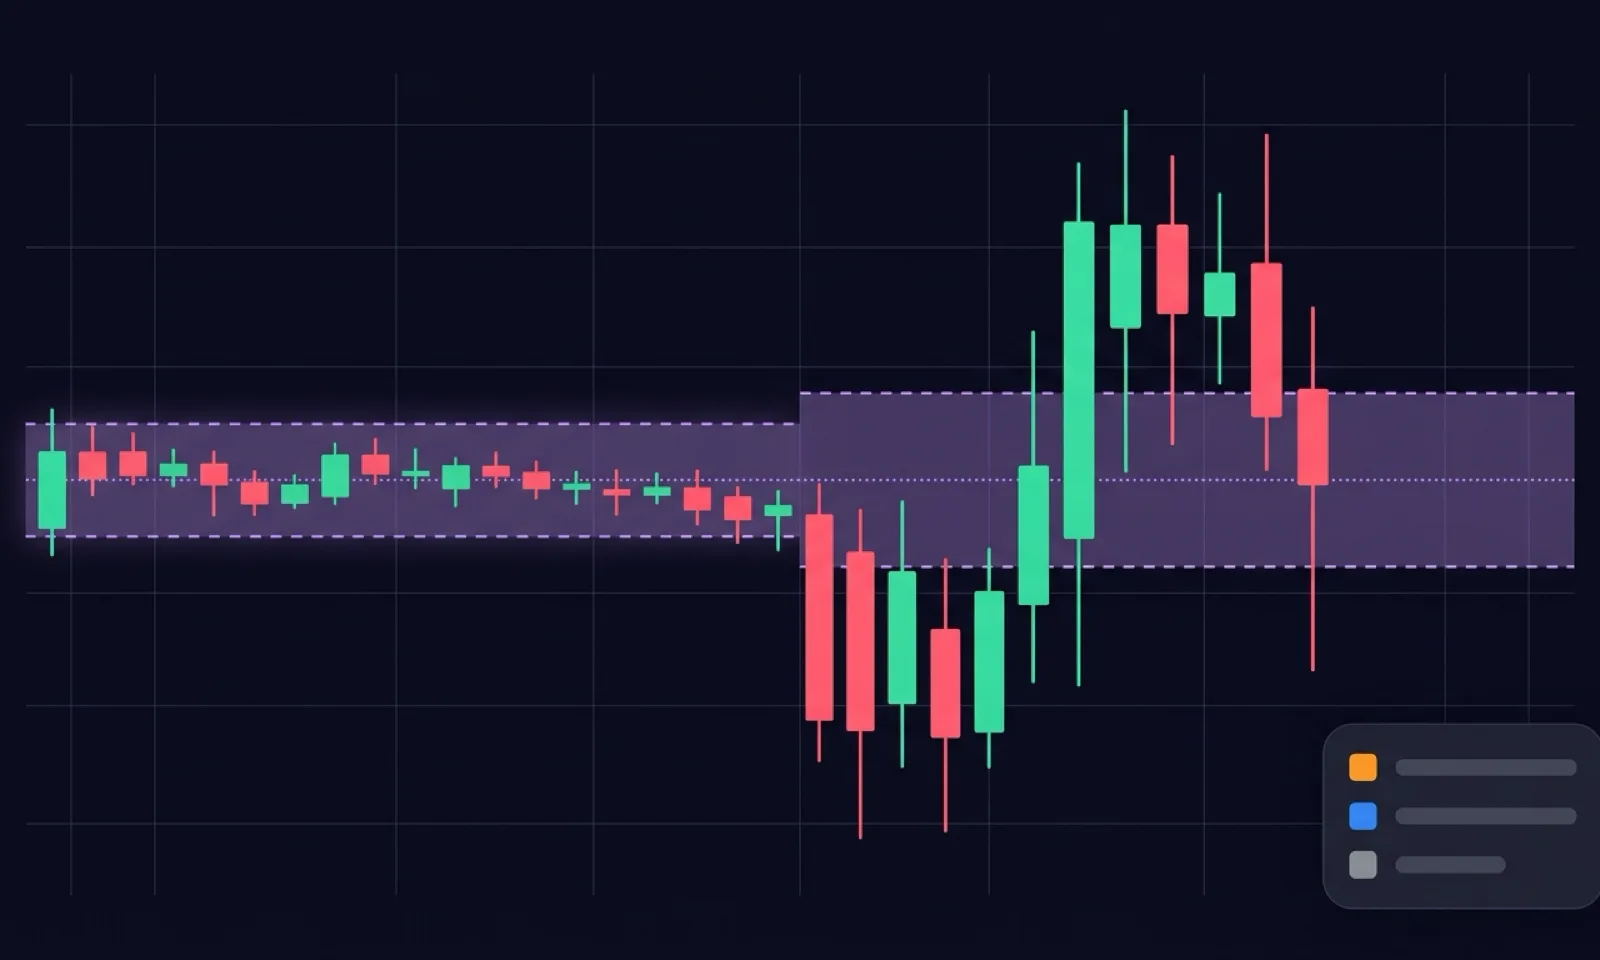
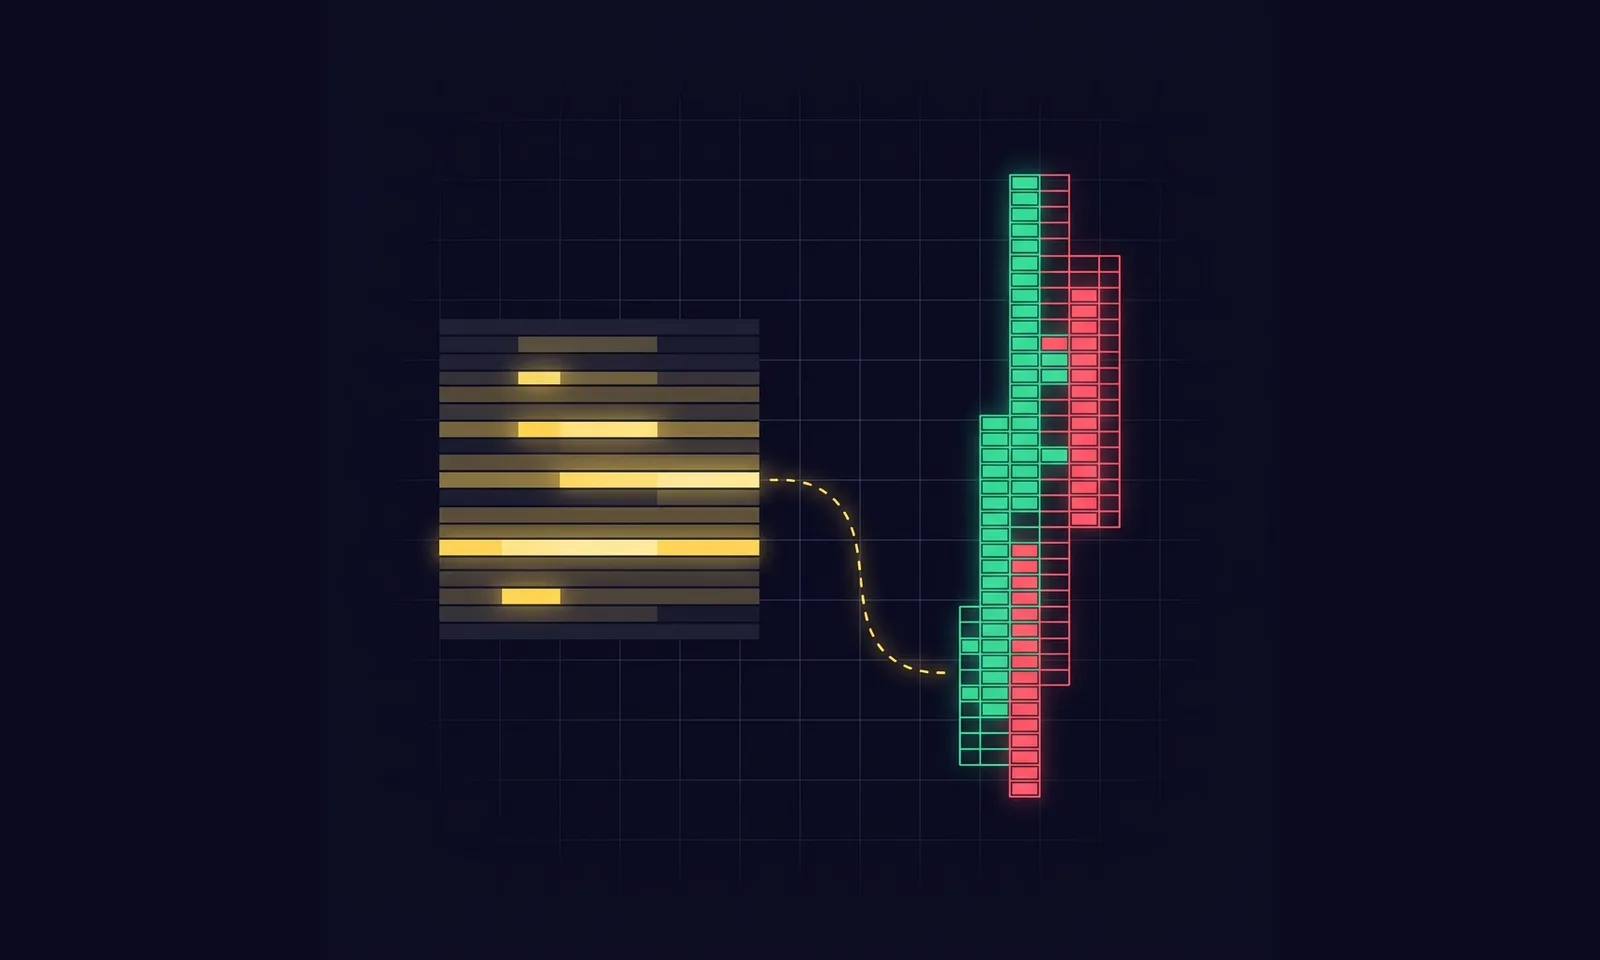
A footprint unpacks every candle into individual price levels, showing aggressive buys (ask) against aggressive sells (bid) at each one. Instead of four OHLC numbers you see the whole auction process — who fought, where, and how hard. It is the most information-dense order flow tool, which is exactly why it's the easiest to drown in. This guide is about what actually carries weight.
Imbalance: dominance read diagonally
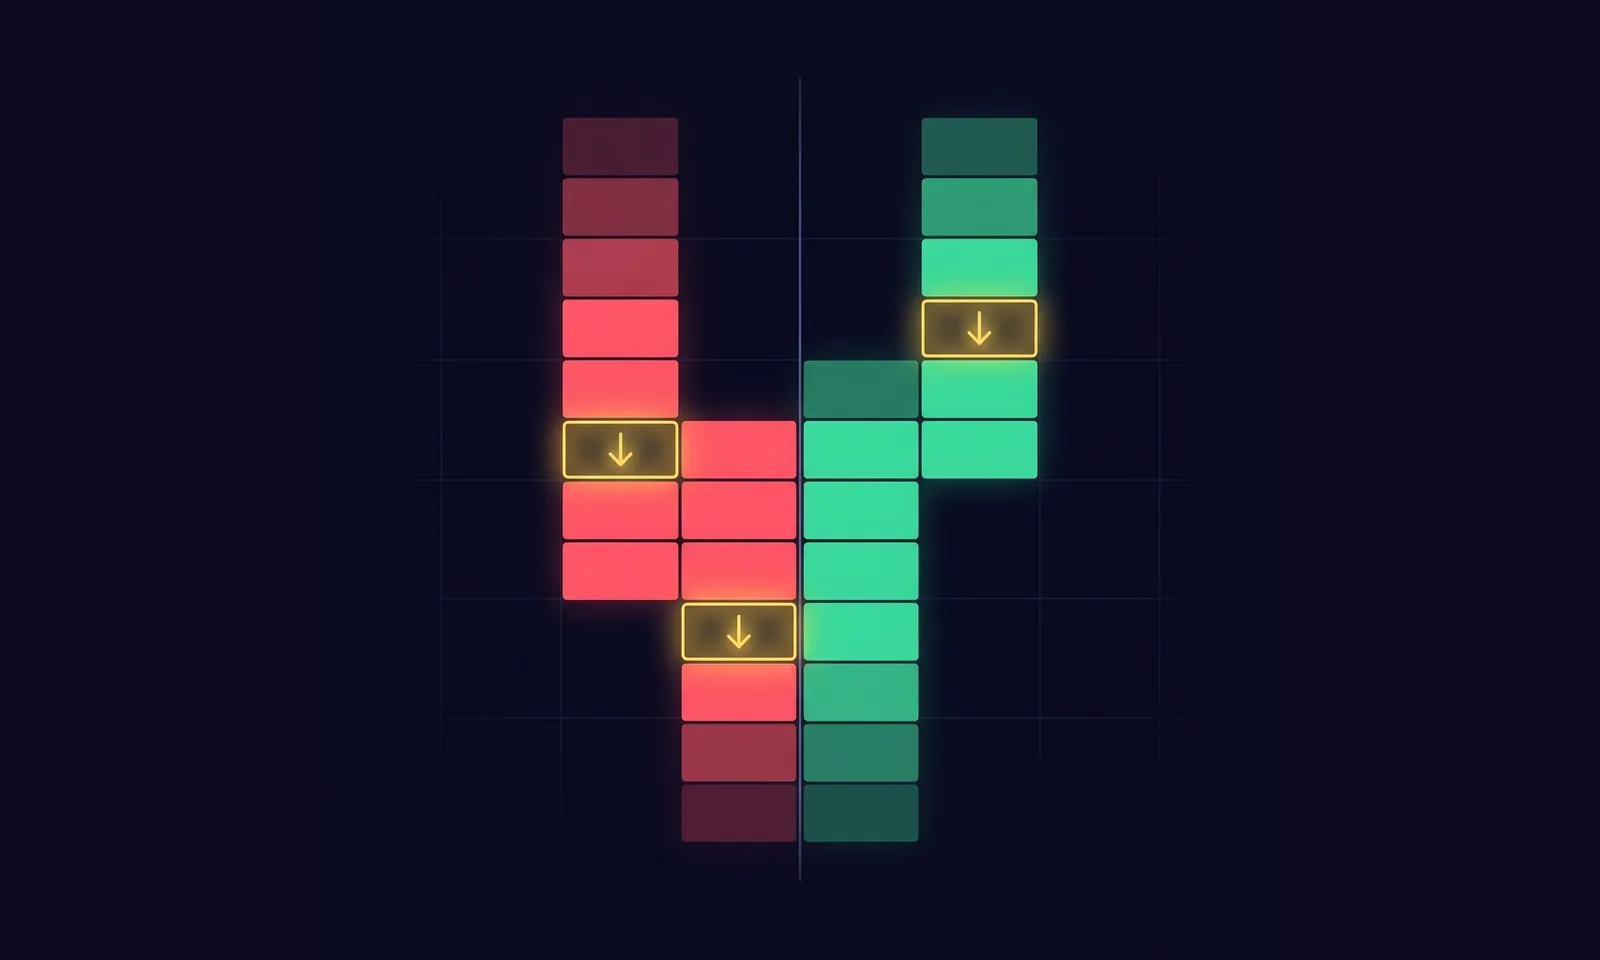
An imbalance = a pronounced dominance of one aggressive side, read diagonally (buys at price P versus sells at P−1 — you compare the forces actually fighting each other). The industry-standard threshold is 300 % (one side ≥ 3× the other).
- When it matters: an imbalance with real volume behind it. A 6:2 cell is technically 300 %, but two contracts are noise — always add a minimum-volume filter scaled to the market's normal.
- Stacked imbalances (3+ consecutive levels on the same side) = a zone of directional conviction and a very significant future S/R zone — a bigger player tends to defend his levels.
- On breakouts you want imbalances in the direction of the break; an imbalance shot through a volume zone with no participation from the other side turns that zone into strong resistance/support.
Absorption: only the significant kind
Absorption = disproportionately large volume at a candle's extreme without price moving on. But you can see some absorption on almost every candle — so only flag what passes three conditions at once:
- Size: volume at the extreme level well above the candle's per-level average (roughly 2× or more).
- Cross ratio: the failing aggressor diagonally dominates the other side — aggressive buying at the high that failed to break through = future resistance.
- Rejection: the close genuinely backed away from the extreme (a real wick, not merely
close < high).
And even then: absorption is never traded on its own — only in confluence with a key level.
The unfinished auction
An anomaly where trades printed on both bid and ask at the absolute high/low of a candle — the auction at the extreme never finished. The market has an extreme tendency to come back and complete it (the higher the timeframe, the stronger the magnet). Usage:
- A target / profit guide — excellent confirmation when it agrees with your idea.
- A warning to close a position when the market is driving away from it against you.
- Never a standalone entry. And note: it is only valid with up/down-tick classification, not in bid/ask display mode.
Why futures (and what to watch elsewhere)
Footprints are most reliable on CME futures (NQ, ES, CL) — every trade clears centrally on the exchange, so the data is complete. In US equities 40–45 % of volume executes off-exchange (dark pools, internalization), so a footprint sees only part of the story.
The most common mistakes
- Trading every absorption/imbalance → overtrading. The tool confirms an idea at a level; it does not find trades for you.
- Reading numbers side by side instead of diagonally.
- Ignoring absolute volume — percentages without contracts are noise.
- Treating the footprint as a substitute for the order book. The footprint is what happened (cannot be retracted); the book is what is offered (can be pulled at any time). Two different kinds of information.
Style fit and what it brings
The footprint is primarily a day trading tool (and a scalper's tool on lower timeframes). It brings precise micro-timing: breakout confirmation, trap detection (trapped traders), hidden S/R zones from imbalances and future magnets from unfinished auctions.
Frequently asked questions
What is a footprint imbalance?
When one side's volume at a price level dwarfs the other read diagonally (often 300% or more), it shows aggressive one-sided trading — frequently hidden support (a buy imbalance) or resistance (a sell imbalance).
When does absorption actually count?
Only when three conditions line up: unusually large volume at the bar's extreme, the aggressor failing to move price, and a rejection wick. Without all three it is just noise — otherwise "absorption" shows up on nearly every candle.
What is an unfinished auction?
When both buyers and sellers trade at the exact high or low (no single-print rejection), the auction is "unfinished" and price often returns to that level later — it acts as a magnet.
Why do footprints work best on futures?
Centralised futures give a clean, consistent bid/ask tape, so the aggressor side of each trade is reliable. On fragmented markets the per-level split is much noisier.
Footprint or heatmap — which do I need?
They answer different questions: the footprint shows executed aggression (what already traded), the liquidity heatmap shows resting liquidity (what is waiting). They are strongest used together.
The Volume Imprint study in WyckFlow has all three detections built in with exactly these filters (volume-gated imbalances, three-condition absorption, unfinished auctions) plus a per-candle Totals table. Related reading: CVD, Bar Delta, Volume Profile.