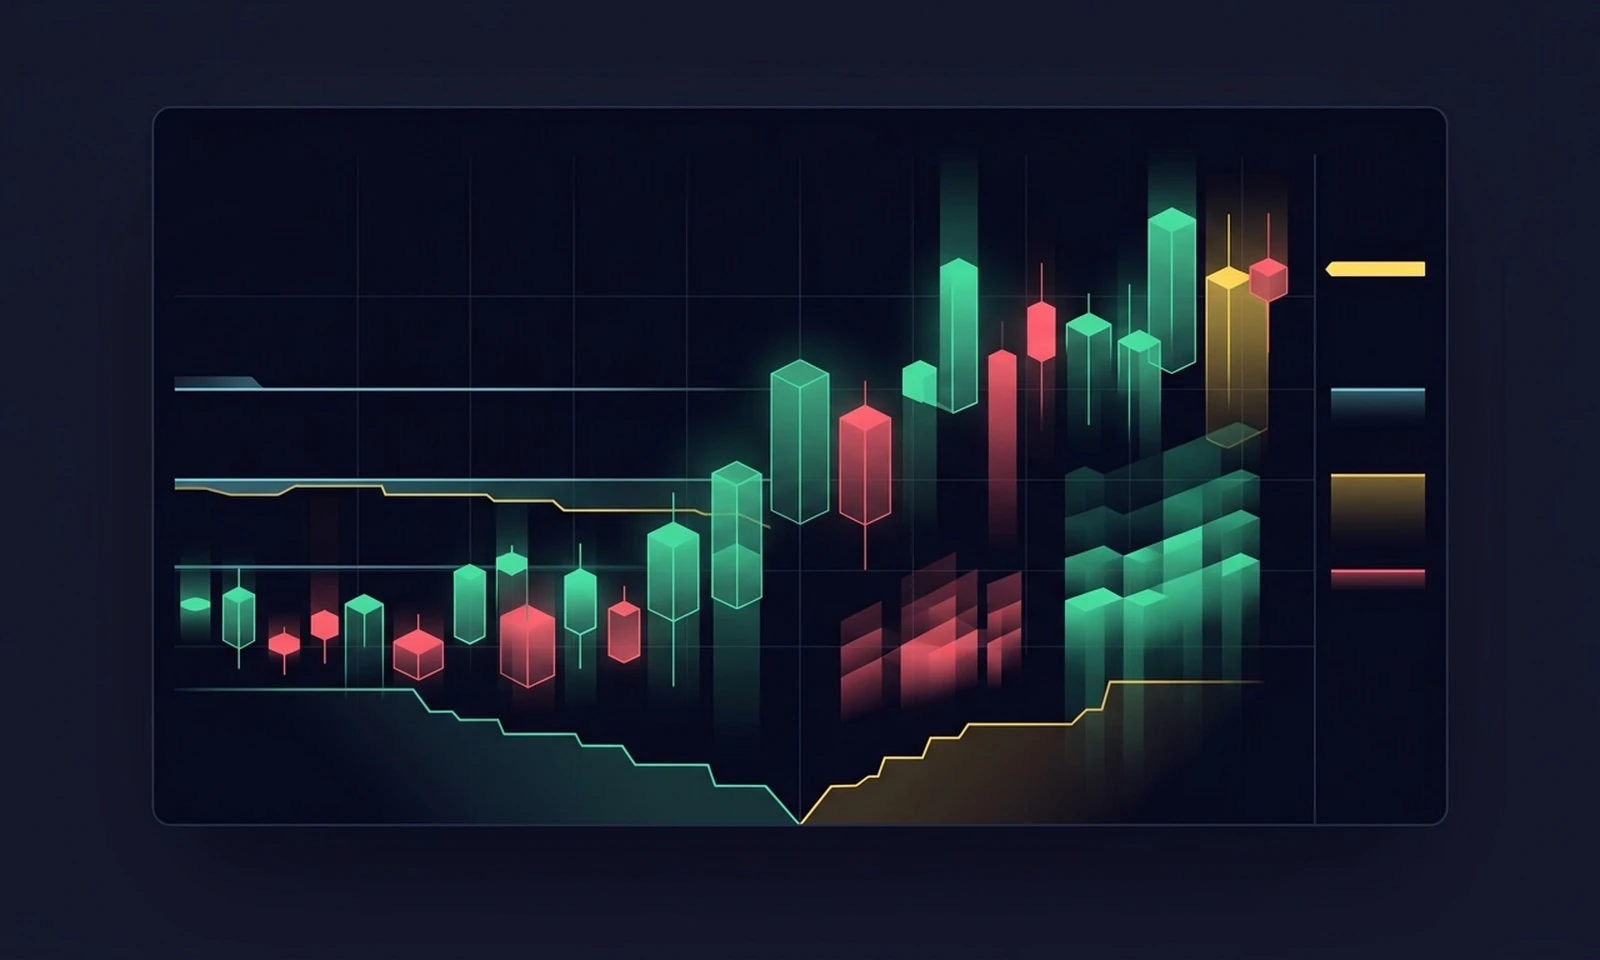
A futures contract roll is a transition from one delivery month to the next, not a directional market signal. Every futures contract expires; to keep exposure, traders close the expiring contract and open the same position in a later contract month, often as a calendar spread.
Because volume and open interest migrate over several days, liquidity splits across two order books while continuous charts stitch together contracts trading at different prices. Reading multi-day profiles, anchored curves, or cumulative order flow across that switch without checking which contract is underneath can make a routine transition look like a structural break.
The quarterly roll cycle and liquidity migration
US equity index futures (ES, NQ) are quarterly: March, June, September, and December. Expiration is usually the third Friday of the expiration month (holidays can shift the date), and the exchange's customary roll date is the Monday before the third Friday. After the roll date, it is customary to treat the next contract as the lead month because the expiring contract will soon terminate and becomes less liquid. The next quarterly roll is in mid-December; other markets roll on their own calendars, so check the contract specs.
Traders decide when to switch by watching volume and open interest in both contracts. As volume migrates over several days, three mechanics affect order-flow readings:
- Split liquidity: Liquidity divides between two contracts, so each order book can look thinner than usual.
- Position transfer: Calendar-spread rolling means some volume around the roll can be position transfer, not directional aggression.
- Price difference: The two months usually trade at different prices (carry and term structure between delivery months, not a market move).
Options expiry (OPEX) is a different event from futures rollover, though in quarterly months the third Friday is usually also the futures expiration (subject to holiday exceptions); see OPEX Week and Expiring Gamma.
Continuous charts: unadjusted versus back-adjusted
A continuous contract stitches successive front-month contracts into one series. Rollover dates and adjustment methods differ between data providers and platforms.
- Unadjusted (spliced) series: Keep real traded prices, so the switch can create a visible jump or gap that is not a real market move.
- Back-adjusted series: With difference adjustment, shift older prices by the difference between contracts; other methods use ratios or cumulative differences. Older prices are synthetic, and the extent of recalculation depends on the selected method.
Consequence: Historical lines and old profile nodes may no longer line up after a back-adjustment; on an unadjusted chart, a level from the old contract sits at a different price than the same area in the new contract.
How rollover affects each order-flow tool
| Tool | What can break at the roll | What to check |
|---|---|---|
| Volume | Spikes or dry-ups on single-contract charts | Migration versus genuine participation |
| Volume Profile | Profiles mixing two contracts | Build per-contract profiles or anchor after the roll |
| CVD | Comparisons mixing two auctions | Compare pivots within one session on one contract |
| VWAP | Multi-day VWAP spanning the switch | Re-anchor on the new contract |
| Bid/ask & Footprint | Filters on split liquidity | Scale to what is normal for that contract at that time |
Volume and Volume Profile
On a single-contract chart, the new contract's volume is low before migration and the old contract's volume dries up after it; "low volume" or "volume spike" readings around the roll can reflect migration or calendar-spread transfers rather than directional participation.
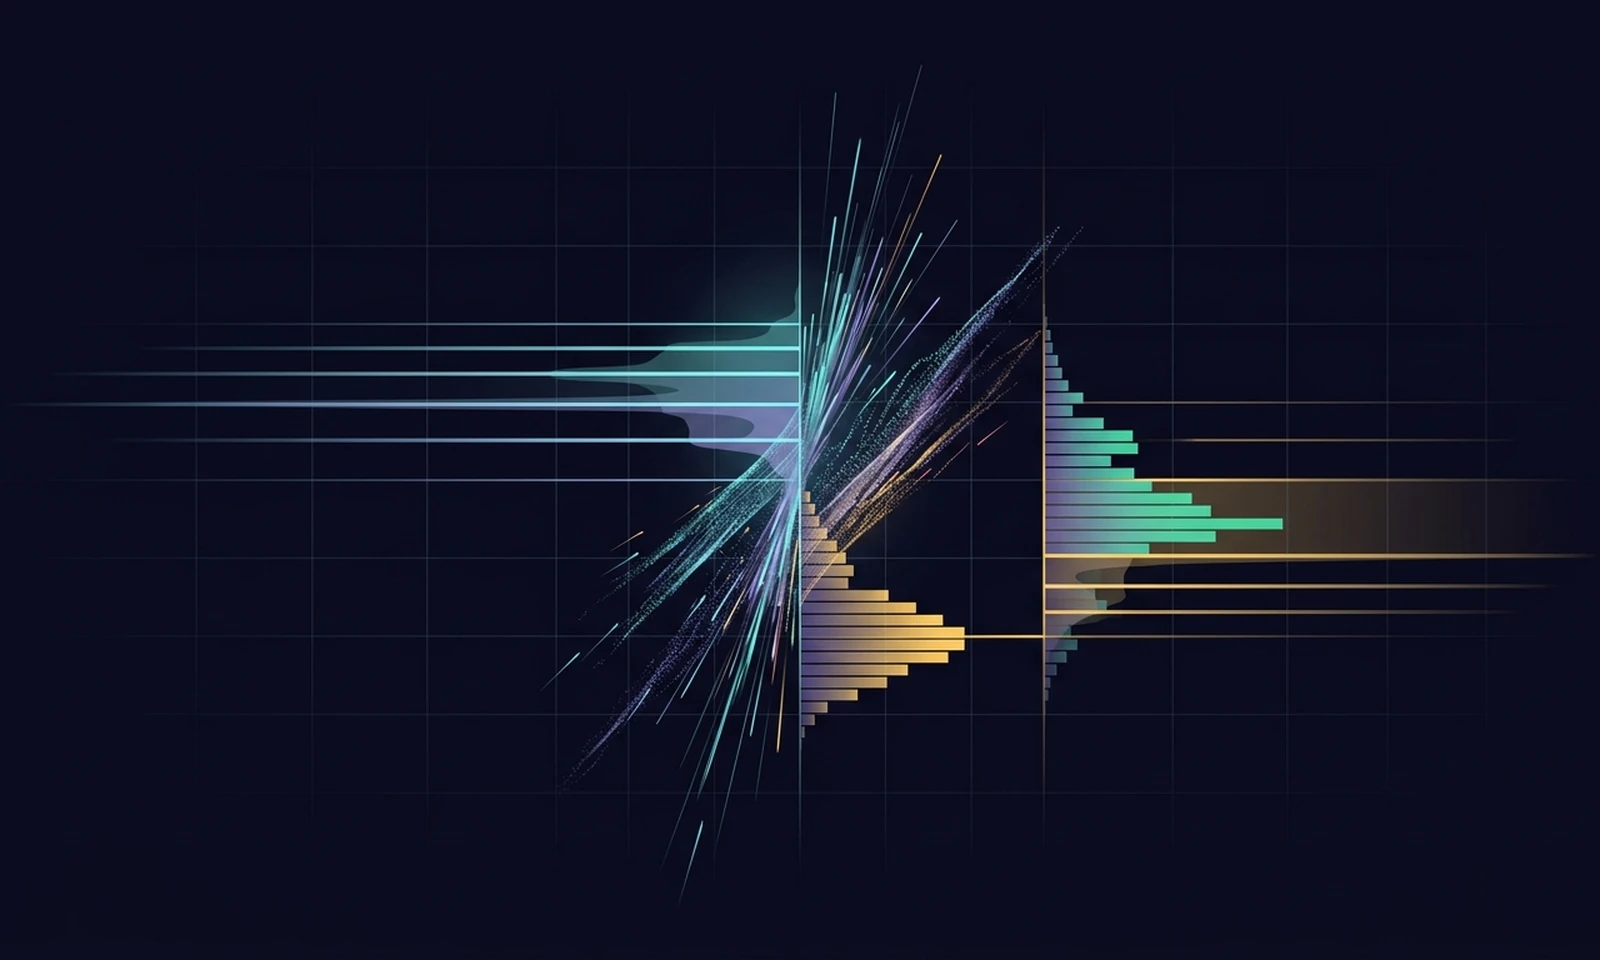
A Volume Profile maps traded volume at each price, showing the Point of Control with the most volume, the Value Area holding roughly 70% of volume, and high- or low-volume nodes. A profile spanning the roll mixes two contracts: old volume stays at old prices on unadjusted charts or moves to synthetic prices on back-adjusted charts. An Anchored Volume Profile requires a logical starting point—random anchoring gives random results. Build per-contract profiles or anchor after the roll.
CVD and VWAP
CVD sums per-bar delta from a chosen reset (typically session start, resetting daily) by taking aggressive buys hitting the ask minus aggressive sells hitting the bid. Compare pivots within the same session; a divergence across the reset is a calculation artifact. Across a roll, the old and new contracts trade in separate order books, so comparing CVD across the switch mixes two auctions—treat it as an artifact, not a signal.
For VWAP, every session starts with a clean slate; comparisons across days must account for the different calculation start and underlying contract. Weekly, monthly, or anchored VWAP spanning the roll mixes two contracts—re-anchor on the new contract.
Bid/ask and Footprint
Aggressive orders trade against resting liquidity; read aggressors at bid versus ask. Tiny absolute volume is noise, so scale footprint and imbalance readings to what is normal. During migration, split liquidity means what is "normal" is changing.
Practical rollover checklist
Staying with the contract where the volume is helps keep order-flow readings comparable from session to session.
- Before the roll: Know your roll calendar and check which contract your chart and feed show.
- During the roll: Watch volume and open interest in both contracts, prefer the contract where the volume is, and scale readings to split liquidity.
- After the roll: Check whether your continuous series is adjusted, redraw or re-anchor levels after the roll, and don't compare CVD, VWAP, or profiles across the switch without accounting for it.
An honest note: Context is not a guarantee. Contract rolls, news, and expiry events can distort what tools show, and continuous-contract methods differ by data provider and platform. Check your own feed—position size is your responsibility.
Frequently asked questions
When do equity index futures roll?
US equity index futures (ES, NQ) are quarterly: March, June, September, and December. Expiration is usually the third Friday of the expiration month (holidays can shift the date), and the exchange's customary roll date is the Monday before the third Friday, with volume migrating over several days.
Should I use a back-adjusted or unadjusted chart for order flow?
Methods differ by data provider and platform. Unadjusted series keep real traded prices with a roll gap; back-adjusted series shift older prices to synthetic values. Check your feed and re-anchor levels on the active contract.
Why does my Volume Profile look wrong after the roll?
A profile spanning the roll mixes two contracts: old volume sits at old prices on unadjusted charts or at synthetic prices on back-adjusted charts. Build per-contract profiles or anchor after the roll.
Why does CVD jump or compare badly across contracts?
CVD sums aggressive buys at the ask minus aggressive sells at the bid from a session reset. Comparing CVD across the roll mixes two separate auctions—an artifact, not a signal.
Is the roll itself a trading signal?
No. Rollover is position transfer between contract months, and the price difference reflects carry and term structure, not a market move.
WyckFlow studies require bid/ask tick data. CVD and Bid/Ask are free forever, Anchored Volume Profile is $11/mo standalone, and Volume Imprint is paid; 14-day free trial of everything, no credit card. Related reading: Volume Profile, CVD, Anchored Volume Profile, VWAP, Bid/Ask Aggressors, OPEX Week.