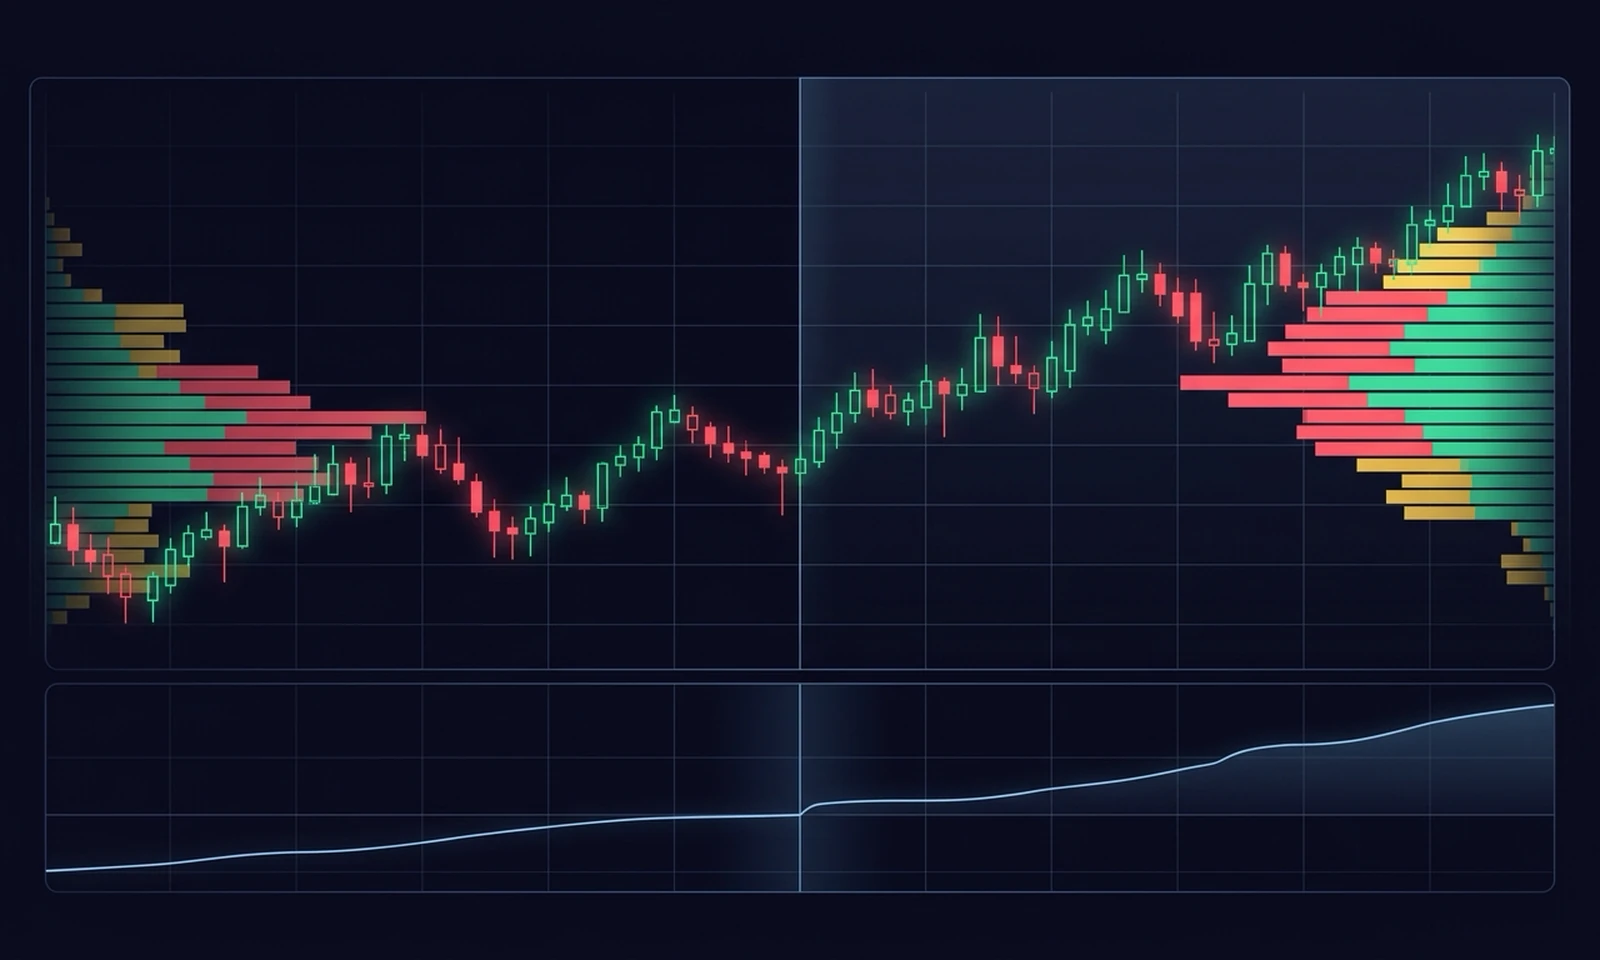
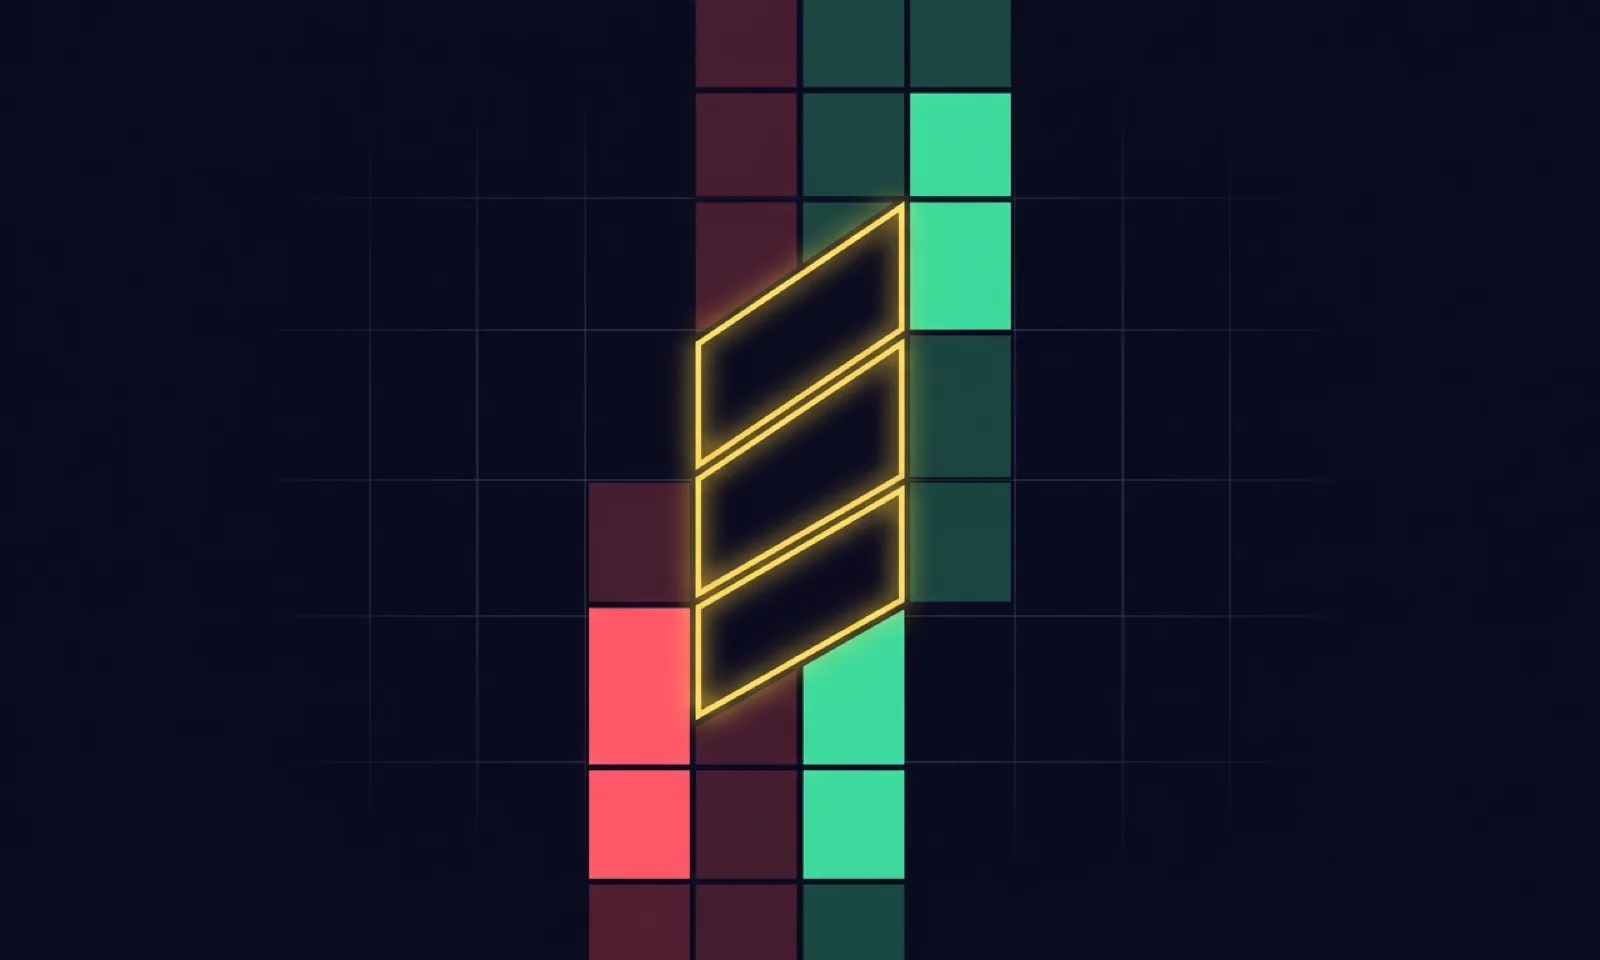
A footprint unpacks aggressive trades within individual candles, so bar type determines which transactions group together. Slicing the tape by time, trade count, or price travel produces distinct per-bar deltas, diagonal imbalance cells, and bar extremes from identical executed trades. Aggressive buying visible as a stacked imbalance on a time bar can split across tick bars or consolidate on a range bar. Neither bar type is superior; each organizes auction data along a different axis.
Same Tape, Different Aggregation
A footprint reveals each candle auction, showing aggressive buying on the ask against aggressive selling on the bid, per bid/ask aggressor volume. Because calculations reset at bar boundaries, the bar definition governs what displays:
- Per-bar delta: Ask minus bid volume within that candle.
- Diagonal imbalances: Buyers at price P versus sellers at P-1 against your ratio threshold.
- Bar extremes: High and low prices, shaping absorption and unfinished auctions.
- Totals table: Volume, net delta, cumulative delta, and delta percentage.
Shifting bar boundaries alters these metrics across identical trades.
The Three Bar Types Defined
- Time bars: Advance after a fixed time interval, regardless of traded volume. Quiet periods hold few trades; fast periods hold many. They align with clock events and session structure.
- Tick bars: Advance after a fixed trade count (ticks as trade prints), regardless of time. They adapt to activity, though contract volume per bar still varies.
- Range bars: Advance only when price covers a fixed price range, regardless of time or trade count. They adapt to activity, isolating price travel.
How Aggregation Alters Footprint Readings
Switching bar types alters how order flow structures appear:
- Imbalances and stacked zones: Imbalances compare aggressive buys at P against sells at P-1 using your ratio threshold. Moving bar boundaries can split volume clusters, hiding imbalances. Conversely, stacked imbalances—three or more consecutive levels on one side showing directional conviction—can print cleanly on a range bar while fragmenting on time bars.
- Bar delta and CVD: Per bar delta mechanics, bar delta measures net candle aggression. A +20 delta on 30 contracts is noise; readings must scale against market and session norms. Cumulative Volume Delta (CVD) sums bar deltas; cumulative trends reflect all trades, while individual bar swings reflect bar aggregation.
- Absorption and unfinished auctions: Real absorption requires three simultaneous conditions: extreme volume well above average, a failing aggressor ratio, and a rejection wick. An unfinished auction—both bid and ask trading at the absolute high or low—acts as a magnet price revisits. Unfinished auctions print at different levels across bar types and require up/down-tick classification, not bid/ask display mode.
Bar Type vs. Price Grouping
The word "tick" carries two distinct meanings:
- Trade print: In a tick bar, a tick is an executed transaction.
- Price increment: In price grouping (tick interval setting), a tick is the smallest price step an instrument moves.
Bar type dictates horizontal boundaries. Price grouping dictates vertical consolidation—combining minimum ticks into one footprint row so the chart stays readable, tuned to your feed and instrument.
Bar Comparison at a Glance
| Bar Type | Trigger | Fast / Active Period | Quiet Period | Key Consideration |
|---|---|---|---|---|
| Time Bar | Fixed time interval | Many trades | Few trades | Aligns with clock events and session structure |
| Tick Bar | Fixed trade count | Adapts to activity | Adapts to activity | Fixed trade count; contract volume varies |
| Range Bar | Fixed price range | Adapts to activity | Adapts to activity | Fixed price range; independent of time |
Common Pitfalls and Misinterpretations
- Low-volume imbalances: A 6:2 cell meets the ratio, but two contracts are noise. A minimum-volume filter scaled to market norms filters thin cells; percentages without volume are noise.
- Off-exchange volume: Footprints are most reliable on centrally cleared CME futures. In US equities, substantial off-exchange volume leaves footprints with partial data.
- Comparing delta across bar types: Extreme delta on a tick bar cannot be compared directly to a time bar. Establish baseline norms for each specific bar setting.
- Assuming tool behavior: Platforms handle non-time bars differently. Study behavior requires verification on live charts.
A Practical Footprint Literacy Checklist
- Pick one bar type and stay consistent: Comparing order flow requires sticking to a single aggregation rather than switching mid-session.
- Scale delta and imbalances to bar norms: Establish baseline volume and delta for your chosen bar setting rather than assuming universal thresholds.
- Apply a minimum-volume filter: Filter thin cells so percentage imbalances reflect real participation, not noise.
- Separate bar type from price grouping: Tune tick interval for vertical readability, independent of horizontal bar duration.
- Verify platform behavior: Test how footprint studies handle non-time bars directly on your charts.
Platform Considerations: MotiveWave
In MotiveWave, the footprint is called Volume Imprint. Community and Standard editions lack native footprint; WyckFlow adds it as a .jar extension (Study menu -> WyckFlow group -> Volume Imprint (Footprint)), per our footprint setup in MotiveWave guide.
Accurate bid/ask volume requires actual trade ticks with volume and bid/ask quotes. Level 2 book depth is a separate input, not a universal footprint requirement. Check historical tick availability with your data provider. The Volume Imprint study replaces candles on futures and crypto, featuring four display modes (Volume Profile, Total volume, Delta, Bid x Ask), autohide numbers, imbalance dots, absorption boxes, unfinished-auction shading, a minimum-volume filter, and a Totals table (volume, net delta, cumulative delta, delta %).
Live study pages do not state whether Volume Imprint supports non-time bars or how it behaves on them; verify behavior directly in your platform and data feed.
An honest risk note: Order flow context and bar aggregation do not eliminate market risk. Scheduled news announcements and contract expiry events can overrun technical levels and footprint patterns. Market conditions change rapidly, trading carries risk of loss, and nothing here is a recommendation.
Frequently asked questions
Why do footprint imbalances look different on tick bars than on time bars?
Imbalances are calculated diagonally within each candle using a ratio threshold you set. Because time bars close by clock interval and tick bars by trade count, executed trades partition differently, changing which price levels compare.
What is the difference between a tick bar and price grouping?
A tick bar uses trade prints to set candle boundaries horizontally. Price grouping (tick interval) sets how many minimum price steps combine into each footprint row vertically.
Can bar delta be compared directly between different bar types?
No. Bar delta measures net aggressive volume within one candle. Because time, tick, and range bars group different transaction totals, delta must be scaled to baseline norms for that specific bar setting.
Does the Volume Imprint study in MotiveWave support non-time bars?
Live study pages do not state whether Volume Imprint supports non-time bars. Test how your study handles non-time aggregations directly in your platform and data feed.
The Volume Imprint study ($17/month) adds footprint charting to MotiveWave, while Delta Volume ($9/month) tracks per-bar delta; CVD and Bid/Ask are free forever, with a 14-day free trial across all tools. Related reading: Footprint: Imbalance & Absorption, Bar Delta, and Stacked Imbalances.