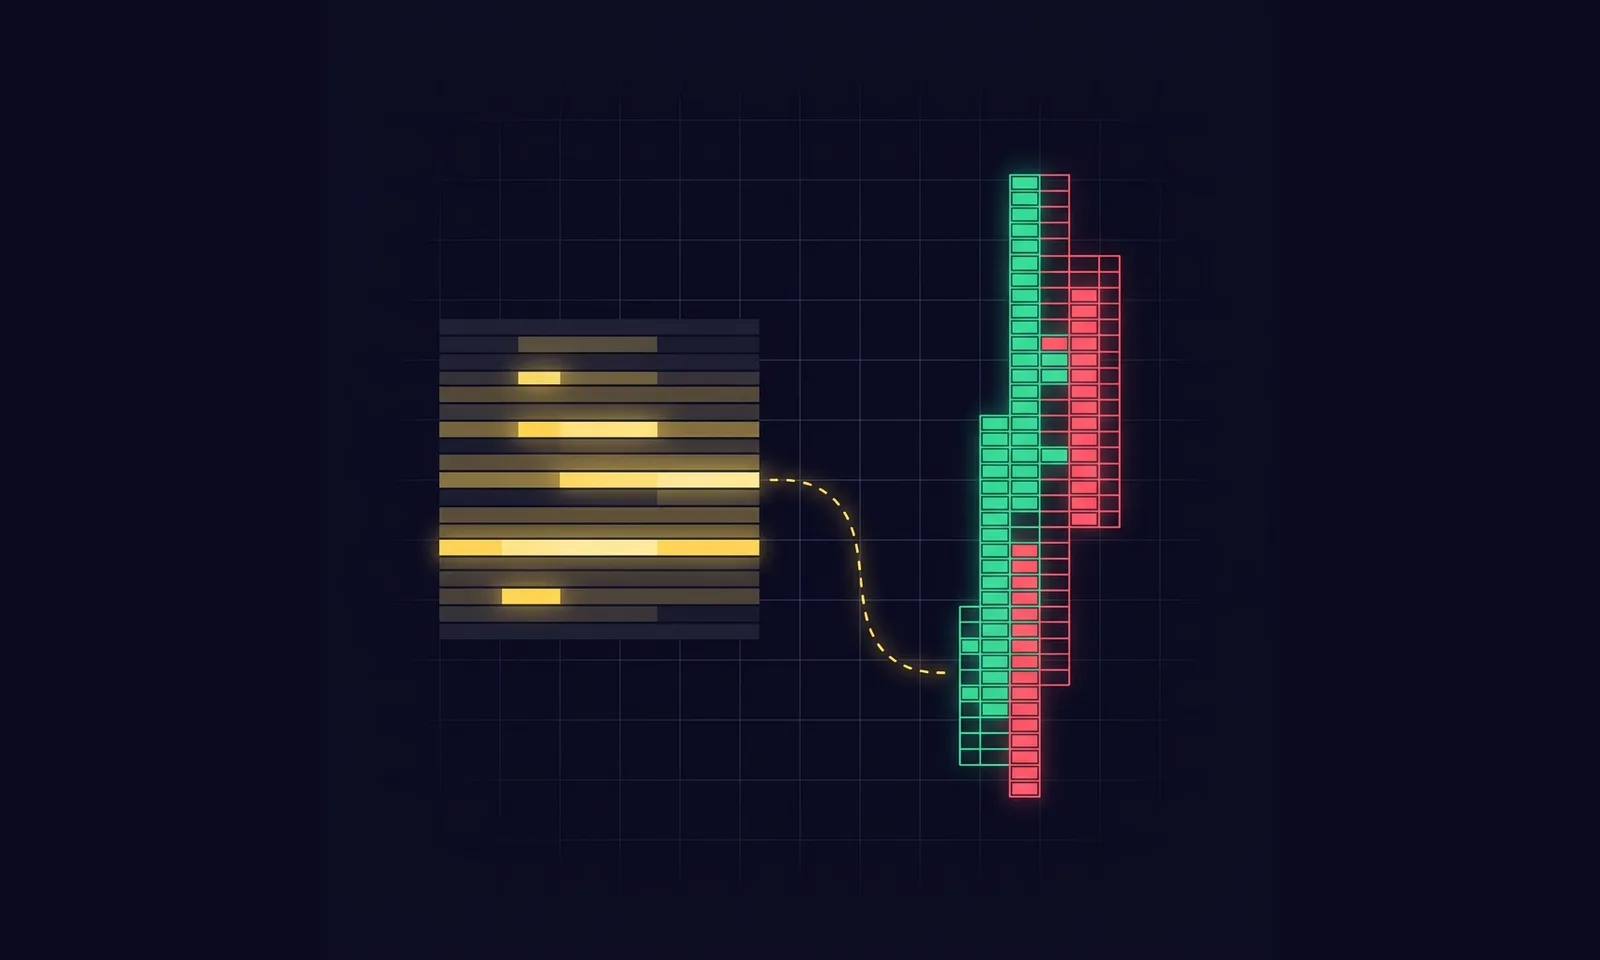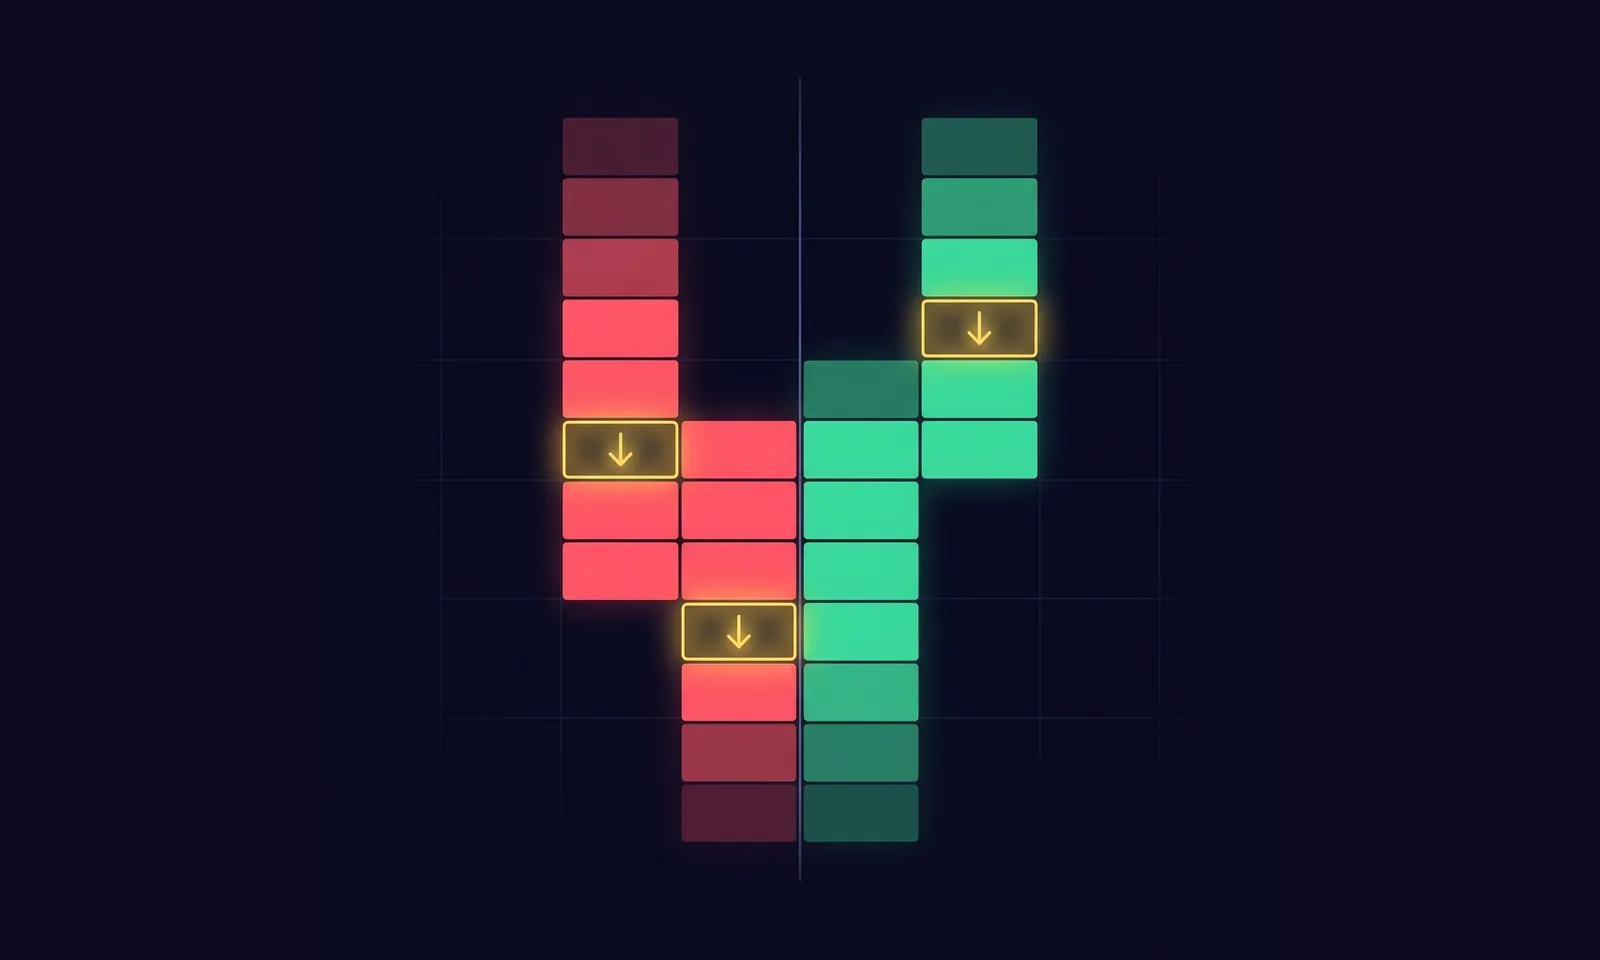
You size a stop for a normal Tuesday, and the market turns into a runaway trend that stops you out three times before it finally goes your way — or you size for a breakout that never comes and give back the day to chop. Both are the same underlying mistake: trading today with yesterday's volatility assumption. Vol Regime exists to fix exactly that gap, and it's worth saying up front what it is not: despite living in the order-flow suite next to delta and footprint tools, it reads bar range and volume, not aggressive buying versus selling — it is a volatility-context dashboard, not a delta or CVD tool.
One Question, Answered Honestly
The study's own documentation is refreshingly blunt about where it came from: an exhaustive search for a mechanical directional edge on this data failed. The one thing that did survive out-of-sample testing was volatility persistence — active markets tend to stay active, quiet markets tend to stay quiet. Vol Regime puts that one proven thing on the chart instead of pretending to know more than it does. It answers "how big, and how likely," and leaves "which way" to the tools built for that job.
The Intraday Regime: EXPANSION, QUIET, NORMAL
The core reading compares a recent window of bar ranges (default 30 minutes) against a longer baseline window (default 180 minutes). The ratio is the compression ratio. Cross above 1.30 for a couple of confirming bars and the regime flips to EXPANSION; drop below 0.80 and it flips to QUIET; in between, it's NORMAL. Because the windows are set in minutes and converted to bars from the chart's own interval, a 5-minute NQ chart and a 1-minute scalping chart read the same underlying condition consistently.
The HUD prints it in plain words so there's no ambiguity: "direction & drift NOT measured."
The Forecast: Order of Magnitude, Not a Prediction
Alongside the regime sits a forecast range for the next hour (or whatever horizon you set) — a square-root-of-time scaling of recent bar range, using a single global constant rather than anything fit per instrument. Treat the number the way you'd treat a weather forecast's expected rainfall: useful for choosing an umbrella size, useless as a guarantee. What's validated is the rank order — bigger regime reading, bigger realistic range — not the exact figure to the tick.
The Day-Activity Badge: Is Today Actually Different?
Separately from the intraday regime, a day-activity badge compares volume in the first hour after the New York open to the trailing median of the same weekday's prior sessions. A Monday is judged against other Mondays, not against Friday's numbers — futures markets have real day-of-week seasonality, and mixing weekdays would just add noise. Until three same-weekday sessions have accumulated (roughly two to three weeks of data), the badge honestly reports "building" rather than guessing.
The Session Envelope: Where Price Usually Reaches
Drawn directly on the price plot, the session expected-reach envelope bands price around the session open using the median realized range of prior complete sessions, optionally widened or narrowed by the day badge. It is a span statistic, not a target: on a meaningful fraction of days price touches or pushes through it. Use it to sanity-check whether your profit target is realistic for the conditions, not as a level to trade off.
Reading the HUD Each Morning: A Practical Checklist
- Check the intraday regime first. EXPANSION means widen stops and targets and expect real follow-through room; QUIET means shrink targets and expect chop; NORMAL needs no adjustment.
- Cross-check the day badge. ACTIVE plus EXPANSION together is the strongest "expect a big day" combination; QUIET plus QUIET is the clearest sit-on-your-hands signal.
- Glance at the envelope before setting a profit target — if your target sits well outside the typical reach for the day's conditions, you're either sizing for a rare day or the target needs rethinking.
- Bring your own direction. Only after the regime supports a big move do you go looking at VWAP, key zones or the footprint for where and which way to actually enter.
- Size risk to the forecast range, not to a fixed tick count — a stop that's comfortable on a QUIET day is often too tight on an EXPANSION day and vice versa.
Common Mistakes
- Reading compression as a squeeze setup. It's tempting to treat a tight EXPANSION-to-QUIET transition as "coiling for a breakout," but the project's own testing disproved that specific story on this data — what's proven is persistence, not a squeeze-then-pop pattern.
- Trading the envelope as a target. It's a typical-reach statistic that gets touched or exceeded routinely, not a take-profit line.
- Confusing it with a volume-based reading elsewhere in the WyckFlow suite. Vol Regime's compression ratio comes from bar range; other tools read raw volume. The two can and do disagree — that's not a bug, they're measuring different things.
- Expecting the day badge to work on day one. It needs a few weeks of same-weekday history before "building" clears.
Summary
- Vol Regime measures magnitude and likelihood of movement, never direction — pair it with a directional tool for entries.
- EXPANSION = wider stops and targets, real room to run; QUIET = smaller targets, expect chop; NORMAL = no adjustment needed.
- The forecast range is an order-of-magnitude estimate, useful for sizing, not a precise prediction.
- The day-activity badge compares this morning to the same weekday's history — give it a few weeks to warm up.
- The session envelope shows typical reach from the open; a touch is not a trade signal.
- It ships in the Starter, Pro and Elite bundles (or standalone) — pure context, meant to sit alongside your other tools rather than replace any of them.
Frequently asked questions
What does Vol Regime actually measure?
Bar-range compression and morning volume, compared against the chart's own recent history — nothing about the direction or aggression of trades. It classifies whether conditions are expanding, quiet, or normal, and forecasts how big the next move is likely to be.
Does a QUIET regime mean a breakout is coming?
No, and this is a common misreading. The study's own testing on its data found volatility persistence, not a squeeze-then-breakout pattern — a quiet market tends to stay quiet longer than traders expect, not compress and then explode on cue.
Why does the day-activity badge sometimes say "building"?
It compares this morning's volume to the same weekday's prior sessions, and needs at least three of them before it will report a real ratio. On a fresh chart or a new instrument, expect a couple of weeks of "building" before it activates.
Is the session envelope a profit target?
No — it's a typical-reach statistic drawn from the median of prior sessions' realized range, and price routinely touches or exceeds it. Use it to check whether a target is realistic for current conditions, not as a level to exit at.
Is Vol Regime part of a paid tier?
Yes — it ships in the Starter, Pro and Elite bundles, or as a standalone purchase, unlike CVD or Bid/Ask Volume which are in the free tier.
WyckFlow Vol Regime ships in the Starter, Pro and Elite bundles — see the full study line-up on wyckflow.com. Related reading: Pressure Meter, CVD.