You watch price stall two ticks below a round number and have no idea whether there's real size sitting there or nothing at all. A footprint tells you what already traded. DOM Ladder tells you what's resting right now, live, at the exact price the candle is forming — bid size below, ask size above, scaled so the biggest levels actually jump out instead of drowning in a wall of numbers.
What it draws
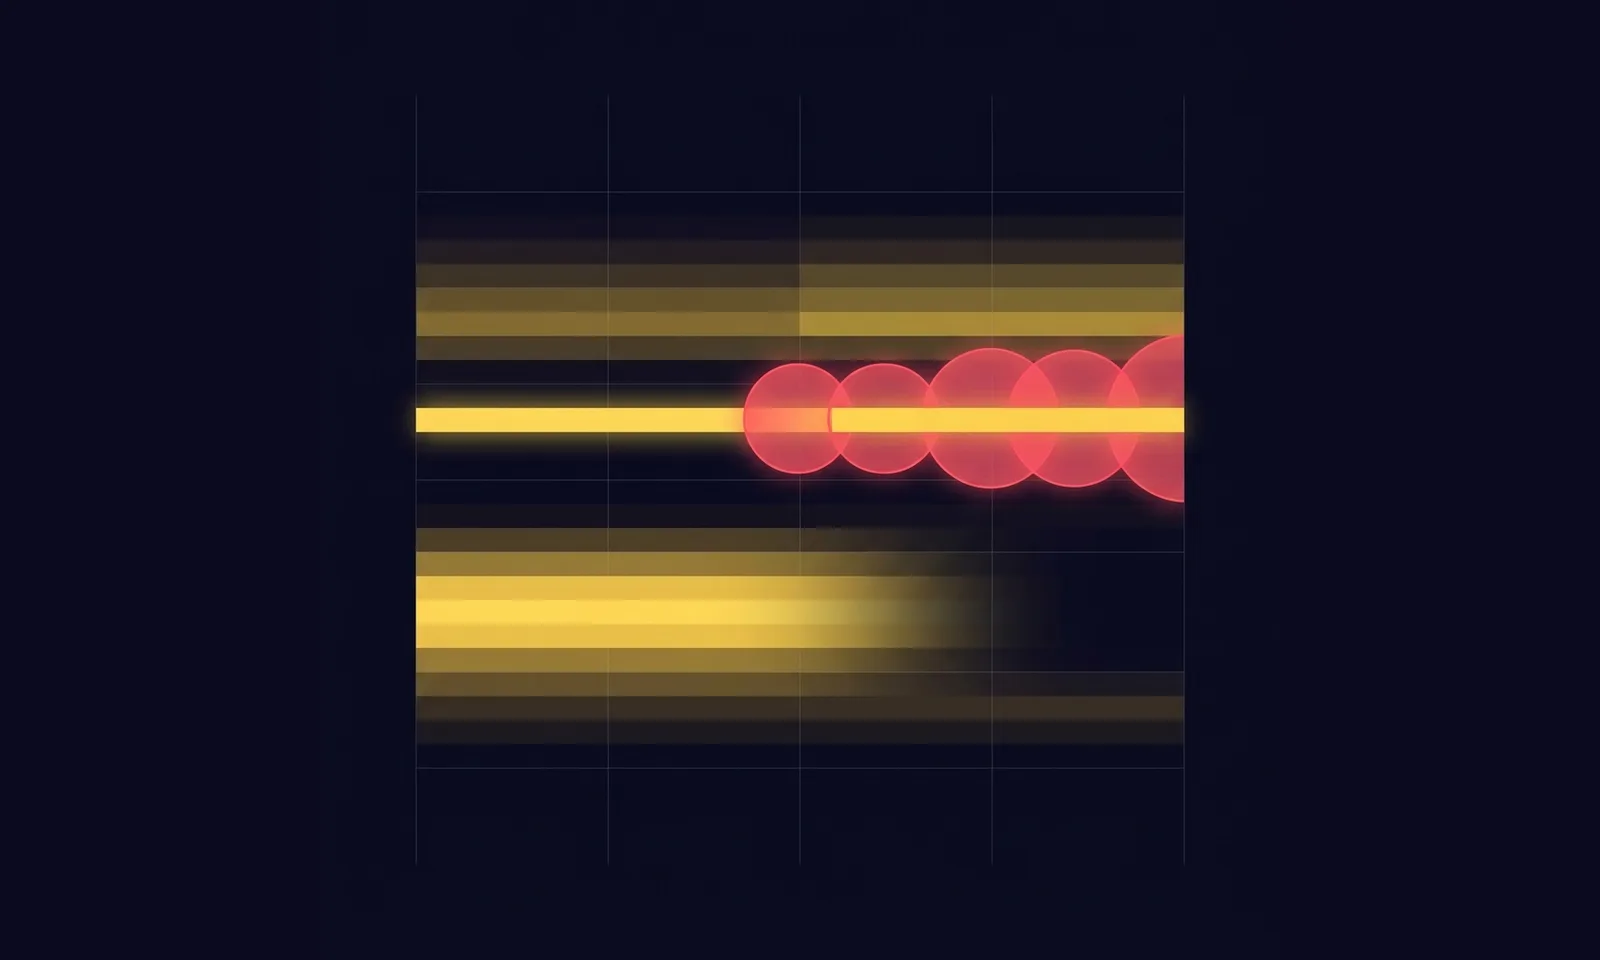
DOM Ladder is an overlay study — it renders on the price panel itself, not a separate pane. On every bar open, update and close, it pulls the latest depth snapshot and paints it as bars pinned to the chart's right edge: resting ask size above price, resting bid size below it, bar length proportional to size, contract count printed per level.
It's the explicit "live" partner to the Liquidity Heatmap study — same price-row mapping, same license tier. The ladder shows the book right now; the heatmap, if it's also on the chart, shows that book's history flowing left. Together: "what's there" and "how did it get there."
Depth is strictly live. There is no historical order book at any feed — scrolling the chart into the past does not change what the ladder shows. It always reflects the current book, full stop.
How the bars stay honest
Every price snaps to the instrument's tick grid, so ladder rows line up 1:1 with the Liquidity Heatmap's rows when you run both.
Bar length is normalized against an anchor size, the "Size filling the full width" setting. A level at or above that anchor fills the full panel width; smaller levels scale down linearly. Left at its default (auto), the anchor recalculates live as the 95th percentile of everything currently shown on both sides — so one freak 400-lot order doesn't flatten every other level into invisible slivers. Set a fixed number instead for a stable scale across the whole session.
If the feed hiccups and a snapshot comes back empty, the study keeps rendering the last good book rather than blanking the panel — a dropped packet shouldn't read as "the book just emptied out."
Numbers that know when to disappear
Size is printed right-aligned at the panel edge, but only when the on-screen row height for one tick is at least as tall as the font. Zoom out far enough and the numbers auto-hide instead of smearing into each other — the same technique the footprint study uses for its own labels. Bars keep rendering at any zoom; only the printed numbers gate off.
A highlight current price row option shades the row at the instrument's last close, so you never lose track of where price sits relative to the two sides while scanning.
Setting it up
- Study menu → WyckFlow → DOM Ladder (Depth). Drops onto the price chart as an overlay — no pane to size.
- Confirm your feed has live bar updates enabled. The study requires them to render at all.
- Open the gear icon — a single "General" tab, split into four groups: Ladder, Display, Diagnostics, License.
- In Ladder, set
Ladder width (px)(default 110) andMax levels per side(default 0 = everything the feed sends). Cap it around 20–40 if you only care about the book near the inside market — some feeds push 100+ levels a side. - In Display, leave
Size numbers per levelon and tuneBar opacity(default 55%) andPanel background opacity(default 35%) to taste. - Leave Diagnostics logging on (default). It writes to
~/MotiveWave Extensions/logs/DomLadder/DomLadder_events.jsonl— check there first if bars stop rendering.
License is a shared footer: DOM Ladder requires the same license bit as Liquidity Heatmap, so if you already have the heatmap, the ladder is already unlocked.
Reading the ladder in practice
- A long bar with a big printed number is a wall. Above price it brakes the way up (supply); below price it brakes the way down (demand) — a level, not a verdict.
- A bar that vanishes right before price touches it is a pulled order — a possible spoof. On the Liquidity Heatmap, look for a matching cut-off stripe there.
- A bar that holds while price tests it repeatedly and bounces away suggests real absorption — confirm against executed volume (Volume Imprint, Big Trades) rather than trusting the bar alone.
- Treat the ladder as context, not a signal. It shows where liquidity sits right now, not where price goes next.
- Nothing renders? Check the diagnostics log:
NO_DEPTH_DATAmeans the feed isn't sending depth;EMPTYmeans the book arrived with nothing in it (or both sides are toggled off). - Numbers missing, bars fine? Almost certainly the row-height auto-hide gate at your current zoom — zoom in vertically, or just read the bars.
- Everything maxed out or tiny? Your
Size filling the full widthanchor is mismatched — switch from auto to a fixed contract count for that instrument.
One hard limit worth internalizing: feeds deliver market-by-price data — aggregated size per level — not market-by-order. DOM Ladder cannot show individual order count at a level, only the combined resting size.
For NQ or ES, 110–140 px of ladder width with the default auto anchor is a reasonable starting point; on ES try a fixed anchor around 300 contracts if auto over- or under-scales the book. On the micros (MNQ/MES), large players sit on the mini contract — don't expect walls of the same size.
Summary
- DOM Ladder overlays the live bid/ask book as scaled bars pinned to the chart's right edge — ask above price, bid below.
- Bar length is normalized against an auto (95th percentile) or fixed anchor so one huge order doesn't flatten the rest of the ladder.
- Size numbers auto-hide when the zoomed row height can't fit the font — a readability gate, not a bug.
- Depth is live-only; there is no historical order book to scroll into.
- Reading it means watching what happens at contact — a bar that holds and absorbs is a level, one pulled just before the touch isn't.
- Feeds are market-by-price only: aggregate size per level, never individual order count.
Frequently asked questions
What does DOM Ladder show that a regular DOM window doesn't?
It's drawn directly on your price chart, scaled and tick-aligned to your timeframe, instead of living in a separate window. Bar length is normalized against a percentile anchor so oversized orders don't drown out the rest of the book visually.
Why did the size numbers disappear from my ladder?
The study auto-hides per-level numbers when a one-tick row is too short on screen to fit the font — deliberate, to stop digits from smearing together when you're zoomed out. Zoom in vertically to bring them back, or rely on bar length alone.
Can I see what the order book looked like an hour ago?
No. DOM Ladder is strictly live — depth has no history at the exchange, so scrolling the chart backward doesn't change what's drawn. For a recorded, scrollable history of the same book, that's the companion Liquidity Heatmap.
Do I need to buy DOM Ladder separately from Liquidity Heatmap?
No. DOM Ladder shares the same license requirement as Liquidity Heatmap — if you're already licensed for the heatmap, the ladder is already unlocked.
Why do all the bars on my ladder look either maxed out or tiny?
Your "Size filling the full width" anchor doesn't match that instrument's typical book depth. Leave it at 0 for an auto-recalculated anchor, or set a fixed contract count that fits what you actually trade.
DOM Ladder ships as part of the Liquidity Heatmap study license in WyckFlow — same tier, no separate purchase. Related reading: Liquidity Heatmap: Telling a Real Wall from a Decoy, Iceberg Orders: A Detection Guide.